Open Access
Fig. 3
Download original image
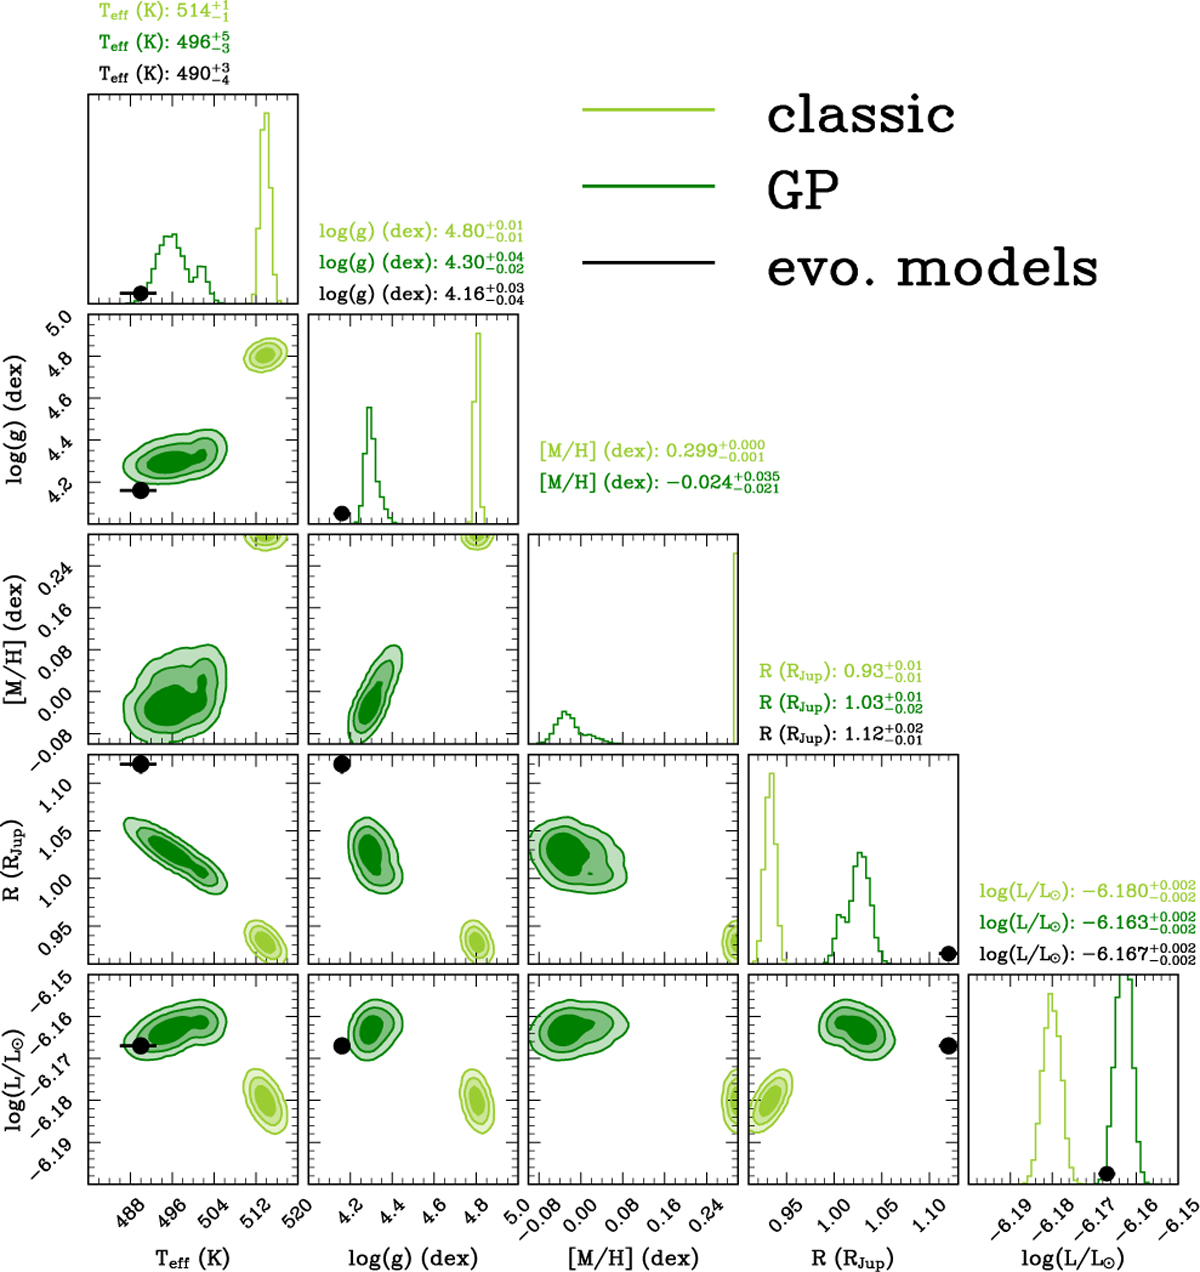
Corner plot comparing forward modeling using the ATMO2020++ grid with (dark green) and without (light green) Gaussian processes (GPs). The black points indicate the mean predictions from evolutionary models with their associated error bars (see Sect. 3.3).
Current usage metrics show cumulative count of Article Views (full-text article views including HTML views, PDF and ePub downloads, according to the available data) and Abstracts Views on Vision4Press platform.
Data correspond to usage on the plateform after 2015. The current usage metrics is available 48-96 hours after online publication and is updated daily on week days.
Initial download of the metrics may take a while.