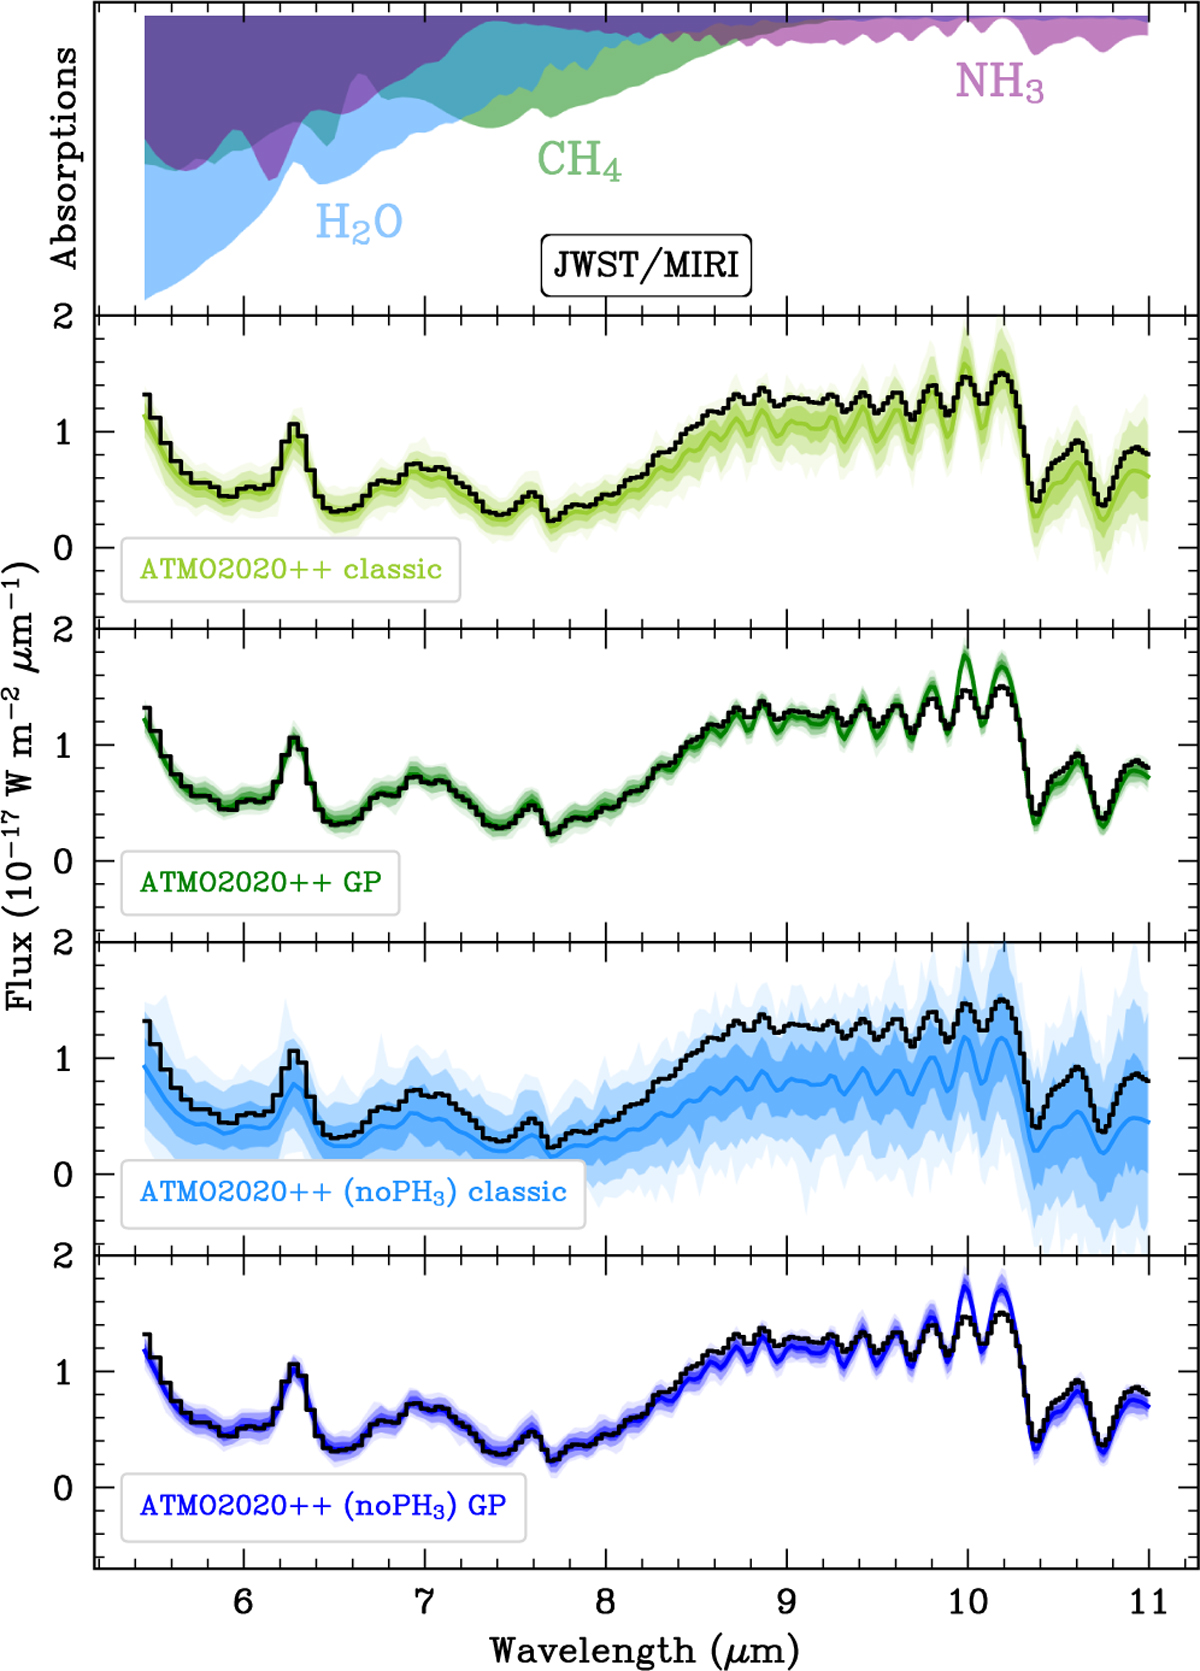
Fig. 4
Download original image
Same as Fig. A.1, but for a comparison between the classical and GP-aided approaches on the JWST/MIRI-LRS spectrum using ATMO2020++ (in green) and ATMO2020++ (no PH3, in blue). Top panel : main molecular absorption features calculated using petitRADTRANS. In the other panels, the black lines show the observed spectrum; the colored lines show the corresponding model spectrum. The shaded regions around the model indicate the 1σ, 2σ, and 3σ dispersions from 200 random draws from the retrieved covariance matrix C. In the classical approach, the covariance matrix is assumed to be diagonal, C = ŝ2 diag(σ2), where ŝ2 is the noise scaling factor and σ the observational uncertainties. Zoom-in on the 5-11 μm region.
Current usage metrics show cumulative count of Article Views (full-text article views including HTML views, PDF and ePub downloads, according to the available data) and Abstracts Views on Vision4Press platform.
Data correspond to usage on the plateform after 2015. The current usage metrics is available 48-96 hours after online publication and is updated daily on week days.
Initial download of the metrics may take a while.