Fig. 1
Download original image
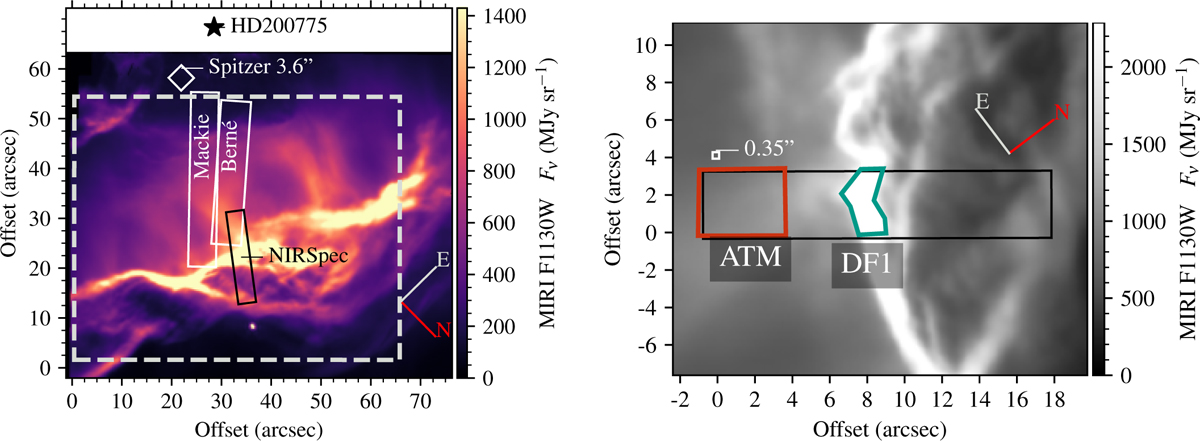
Left: position of HD 200775 relative to the NGC 7023 NW filament and footprints of the NIRSpec observations. The background is the F1130W map from the MIRI imager observations of the same program (Misselt et al. 2025). The dashed rectangle indicates the coverage of Spitzer-based spectroscopy and feature maps (Werner et al. 2004; Shannon et al. 2015), which includes coverage closer to the star, where C60 was observed. The labeled footprints are the regions of interest for the studies by Berné & Tielens (2012) and Mackie et al. (2015). The diamond (a 3.6″ square) indicates the typical spectral extraction size for Spitzer-based studies. Right: zoom-in of the same image, showing the two extraction apertures of Misselt et al. (2025) used for the demonstration in Figs. 2 and 3, and the size of a single 0.35″ spaxel of our spectral extractions (Sect. 2). The edge of the mosaic is around 37″ away from the star.
Current usage metrics show cumulative count of Article Views (full-text article views including HTML views, PDF and ePub downloads, according to the available data) and Abstracts Views on Vision4Press platform.
Data correspond to usage on the plateform after 2015. The current usage metrics is available 48-96 hours after online publication and is updated daily on week days.
Initial download of the metrics may take a while.