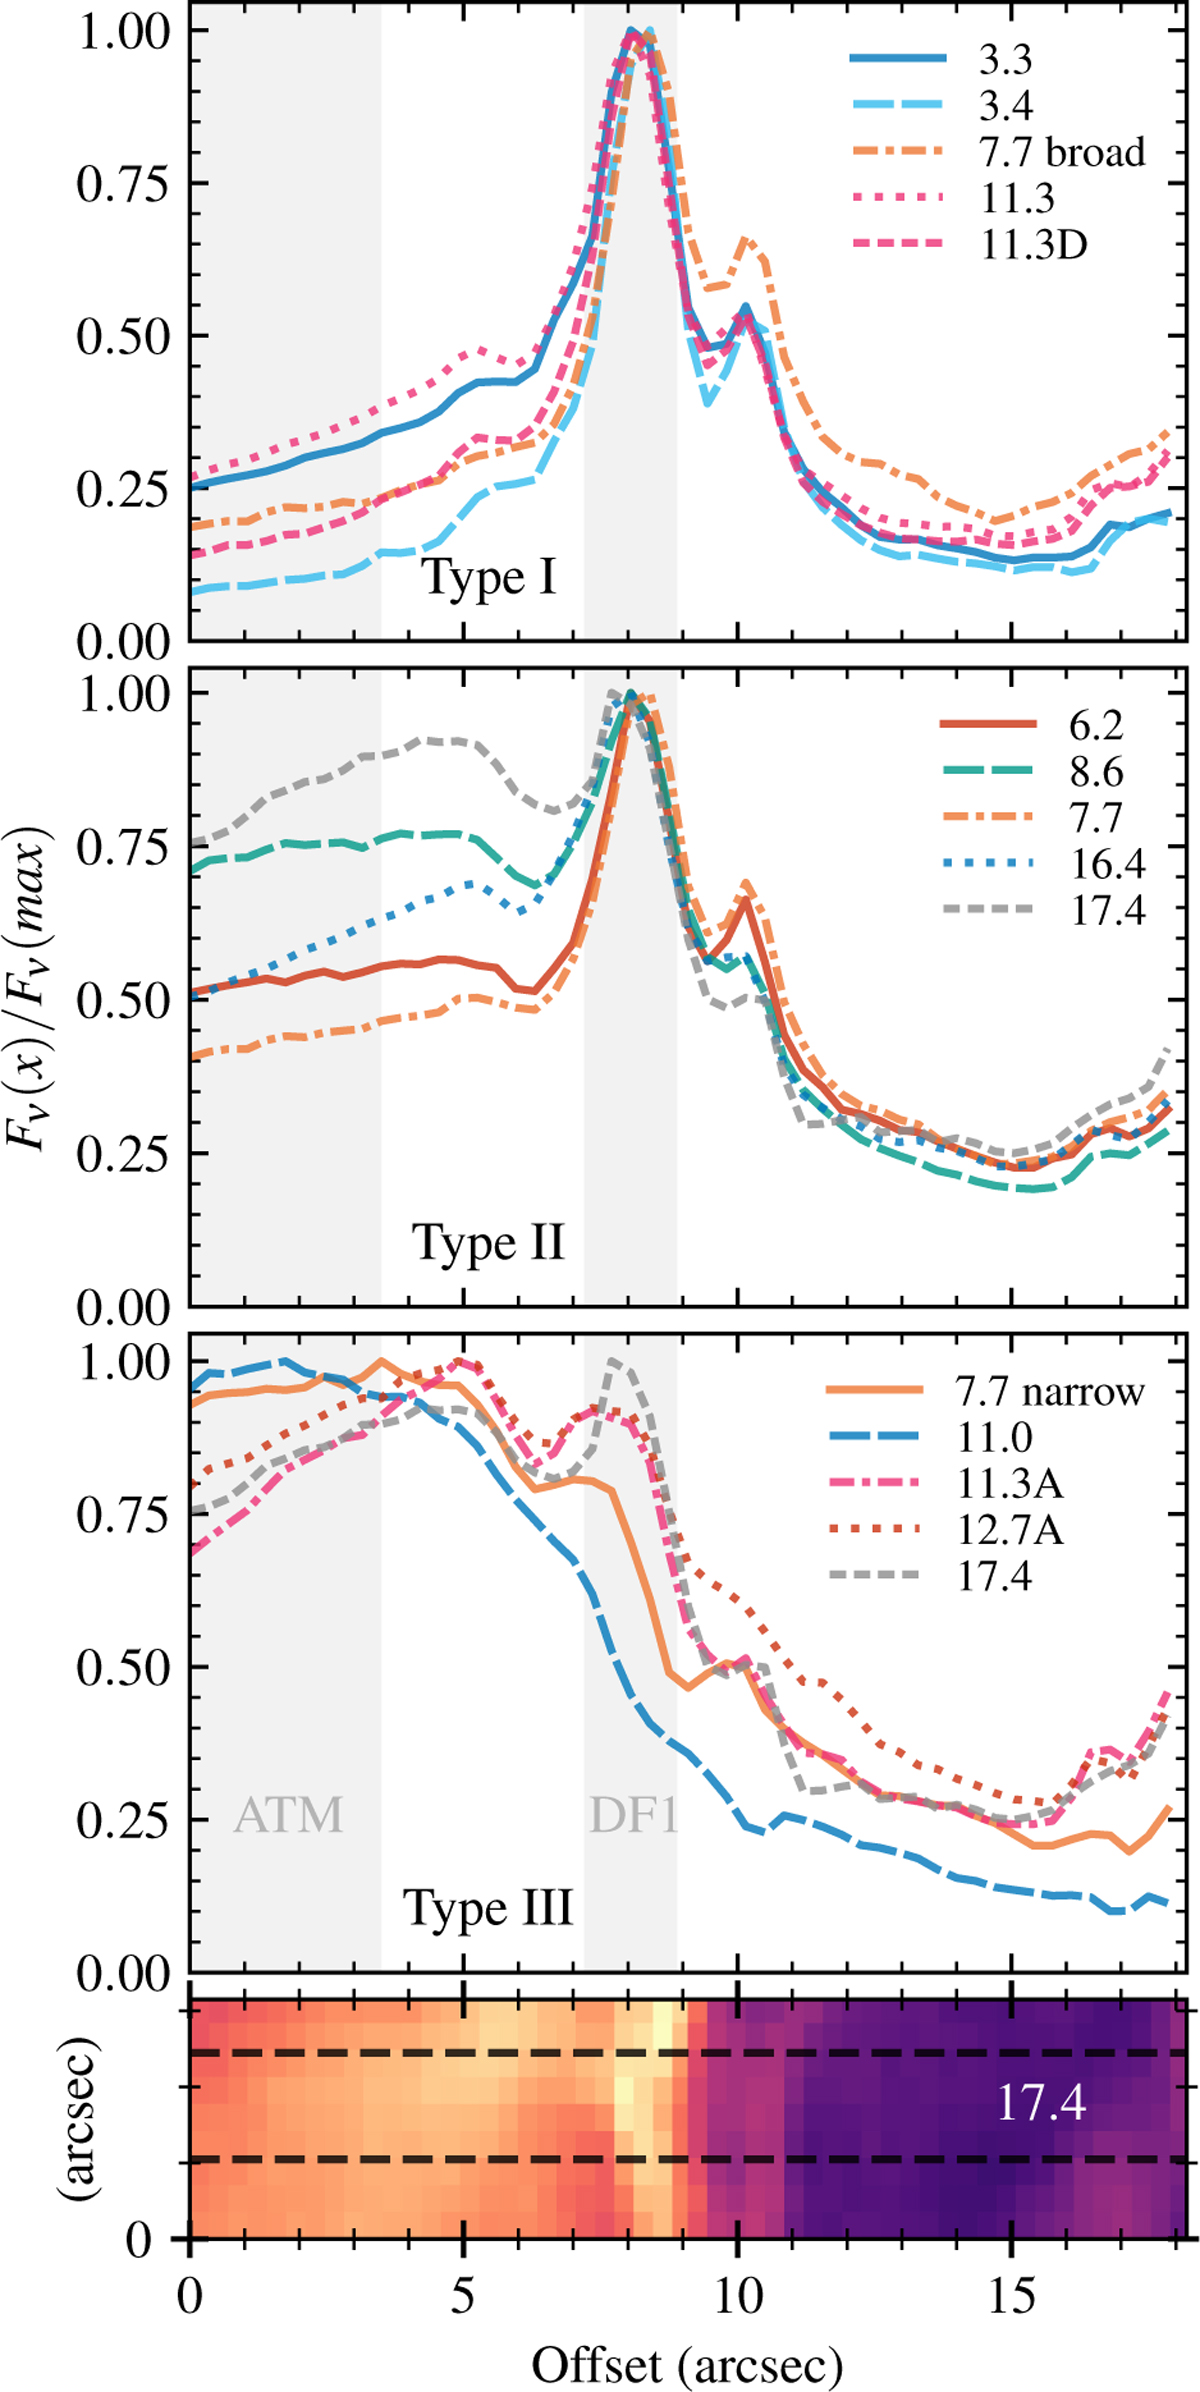
Fig. 10
Download original image
Spatial profiles along cuts perpendicular to the DF for selected features, normalized to the peak of each cut. The cuts are organized by spatial distribution types I, II, and III, as introduced in Sect. 4.3. The 17.4 µm cut is shown twice to directly compare it to the type II and type III cuts. The dashed lines in the bottom panel indicate the region over which the maps were median-stacked along the vertical axis to obtain the cuts, with the 17.4 µm map from Fig. 5 in the background. The shaded areas indicate the widths of the ATM and DF1 regions.
Current usage metrics show cumulative count of Article Views (full-text article views including HTML views, PDF and ePub downloads, according to the available data) and Abstracts Views on Vision4Press platform.
Data correspond to usage on the plateform after 2015. The current usage metrics is available 48-96 hours after online publication and is updated daily on week days.
Initial download of the metrics may take a while.