Fig. 11
Download original image
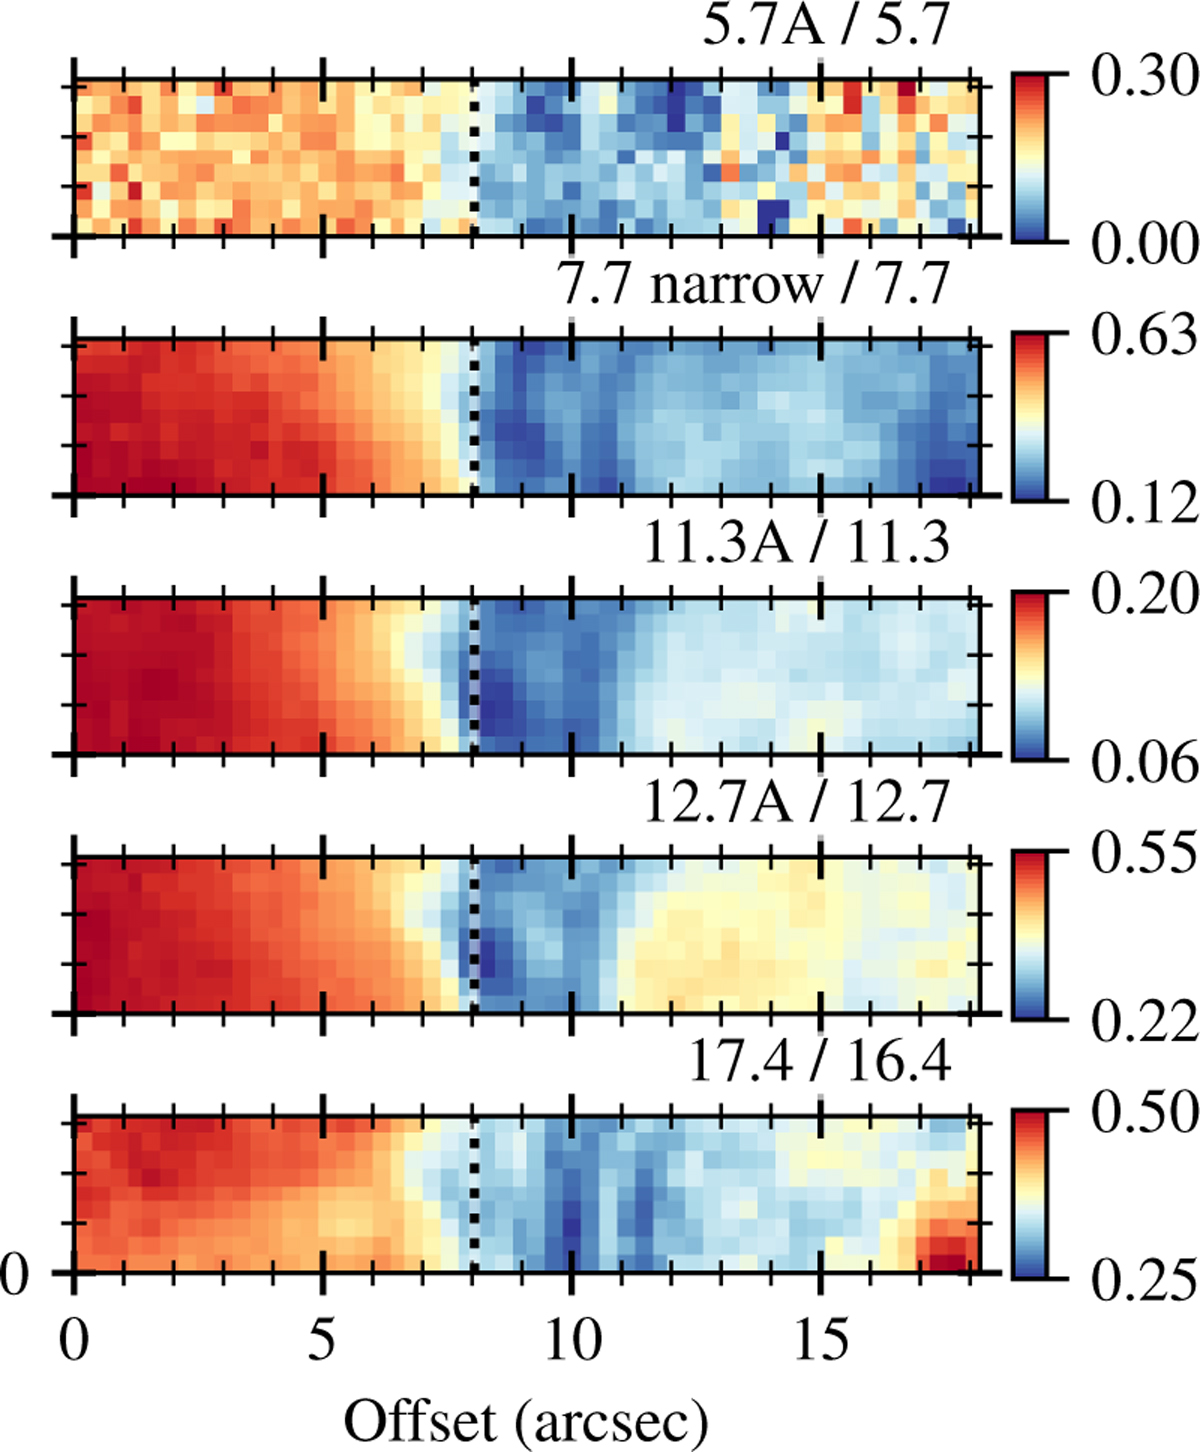
Maps of ratios describing variations in the band profiles. The color bars represent a linear scale between the minimum and maximum. The ratios represent the relative contributions of subcomponents to the total as defined in Table 1. The ratios of the bluest components of each complex are shown alongside the 17.4/16.4 ratio to illustrate their similarity, and how the steepest gradient is in the same location.
Current usage metrics show cumulative count of Article Views (full-text article views including HTML views, PDF and ePub downloads, according to the available data) and Abstracts Views on Vision4Press platform.
Data correspond to usage on the plateform after 2015. The current usage metrics is available 48-96 hours after online publication and is updated daily on week days.
Initial download of the metrics may take a while.