Fig. 13
Download original image
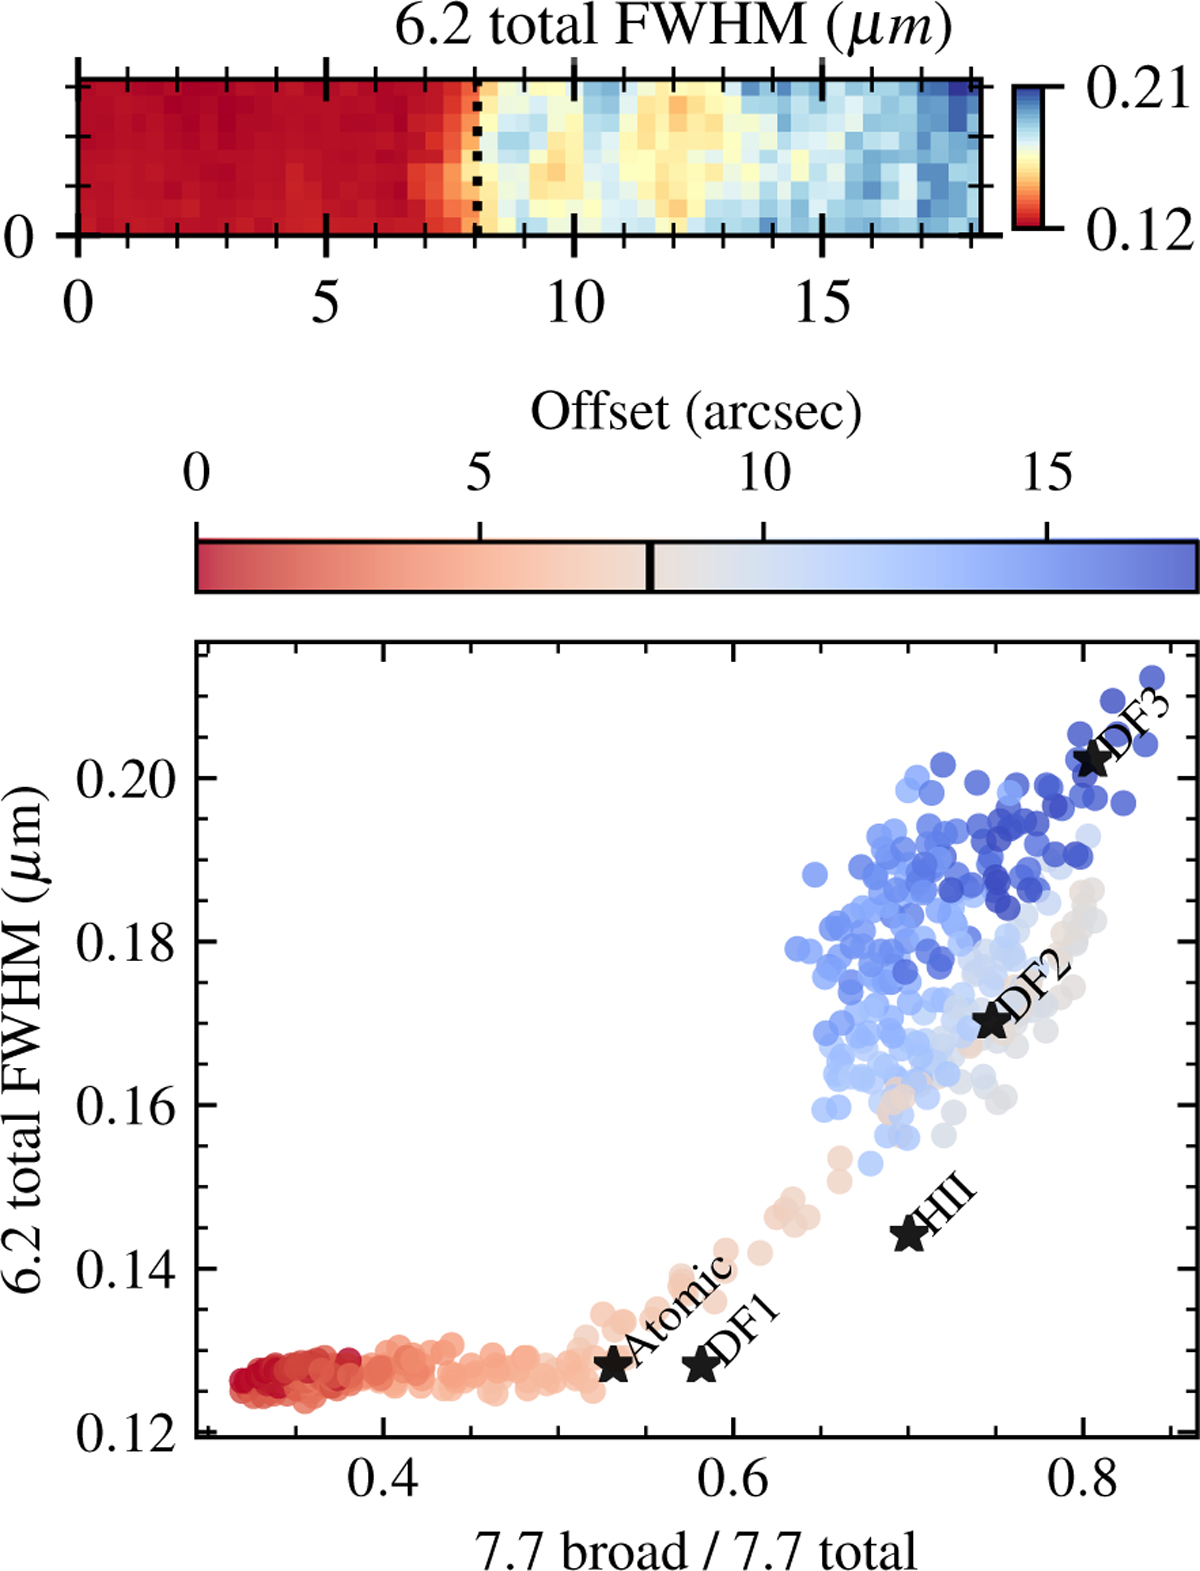
Profile diagnostics diagram based on the 6.2 and 7.7 µm profiles, comparing our results for NGC 7023 (colorful circles) with those for the five Orion Bar template spectra (labeled markers, Van De Putte et al. 2025). The color bar indicates the position in the NGC 7023 mosaic and the black marker bar is the location of DF1. In the atomic PDR regime, the NGC 7023 spectra exhibit much more strongly pronounced 7.7 µm narrow features compared to the Orion Bar “Atomic” template. The 6.2 µm FWHM tends to a constant value, and the upper panel shows a map of the 6.2 µm FWHM with DF1 marked by the dotted line. For the more shielded regime (NGC 7023 beyond DF1; Orion Bar HII, DF2, and DF3), the data points follow a similar path in the diagram for both objects.
Current usage metrics show cumulative count of Article Views (full-text article views including HTML views, PDF and ePub downloads, according to the available data) and Abstracts Views on Vision4Press platform.
Data correspond to usage on the plateform after 2015. The current usage metrics is available 48-96 hours after online publication and is updated daily on week days.
Initial download of the metrics may take a while.