Open Access
Fig. A.2
Download original image
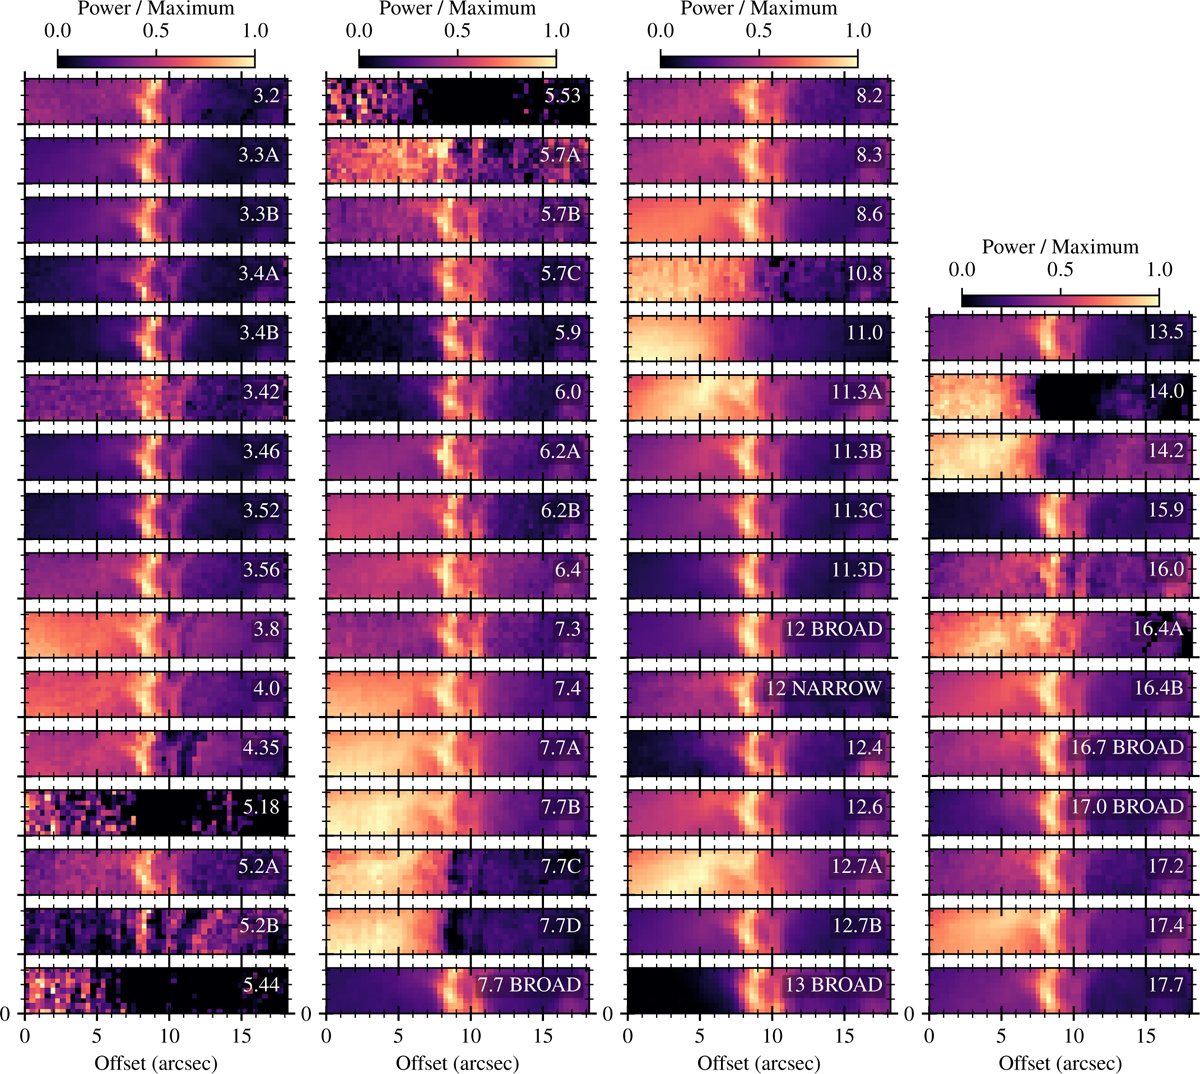
Full overview of spatial distributions extracted from PAHFIT results. The maps show normalized quantities analogous to Fig. 5: the frequency-integrated surface brightness (W m−2 sr−1), divided by the maximum value of the map.
Current usage metrics show cumulative count of Article Views (full-text article views including HTML views, PDF and ePub downloads, according to the available data) and Abstracts Views on Vision4Press platform.
Data correspond to usage on the plateform after 2015. The current usage metrics is available 48-96 hours after online publication and is updated daily on week days.
Initial download of the metrics may take a while.