Fig. 2
Download original image
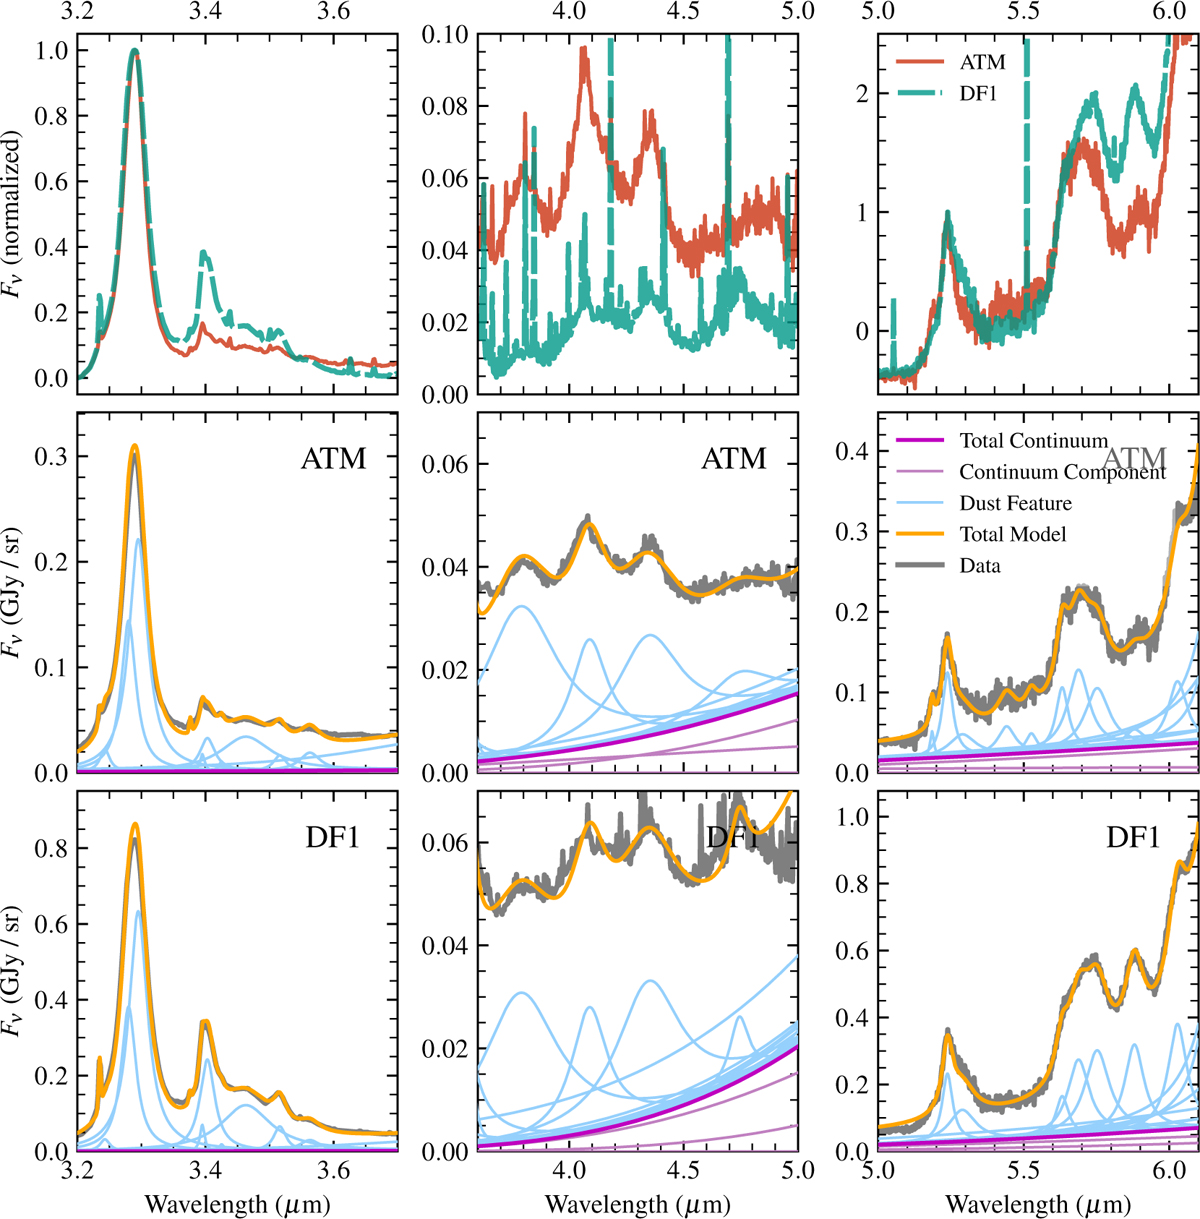
Zoomed-in view of the emission complexes in the ATM and DF1 regions of NGC 7023 and the corresponding PAHFIT decompositions. The aperture-extracted spectra (defined in Sect. 2 and Fig. 1) are shown in the top panels with a normalization and offset that match the base and peak of a certain feature (first and second columns scaled to 3.3 µm, third column to 5.2 µm). These still have the emission lines included. The gray lines in the bottom two rows are the modified ATM and DF1 spectra (emission lines removed), used as input for PAHFIT. The components of the decomposition are shown as labeled in the legend.
Current usage metrics show cumulative count of Article Views (full-text article views including HTML views, PDF and ePub downloads, according to the available data) and Abstracts Views on Vision4Press platform.
Data correspond to usage on the plateform after 2015. The current usage metrics is available 48-96 hours after online publication and is updated daily on week days.
Initial download of the metrics may take a while.