Fig. 4
Download original image
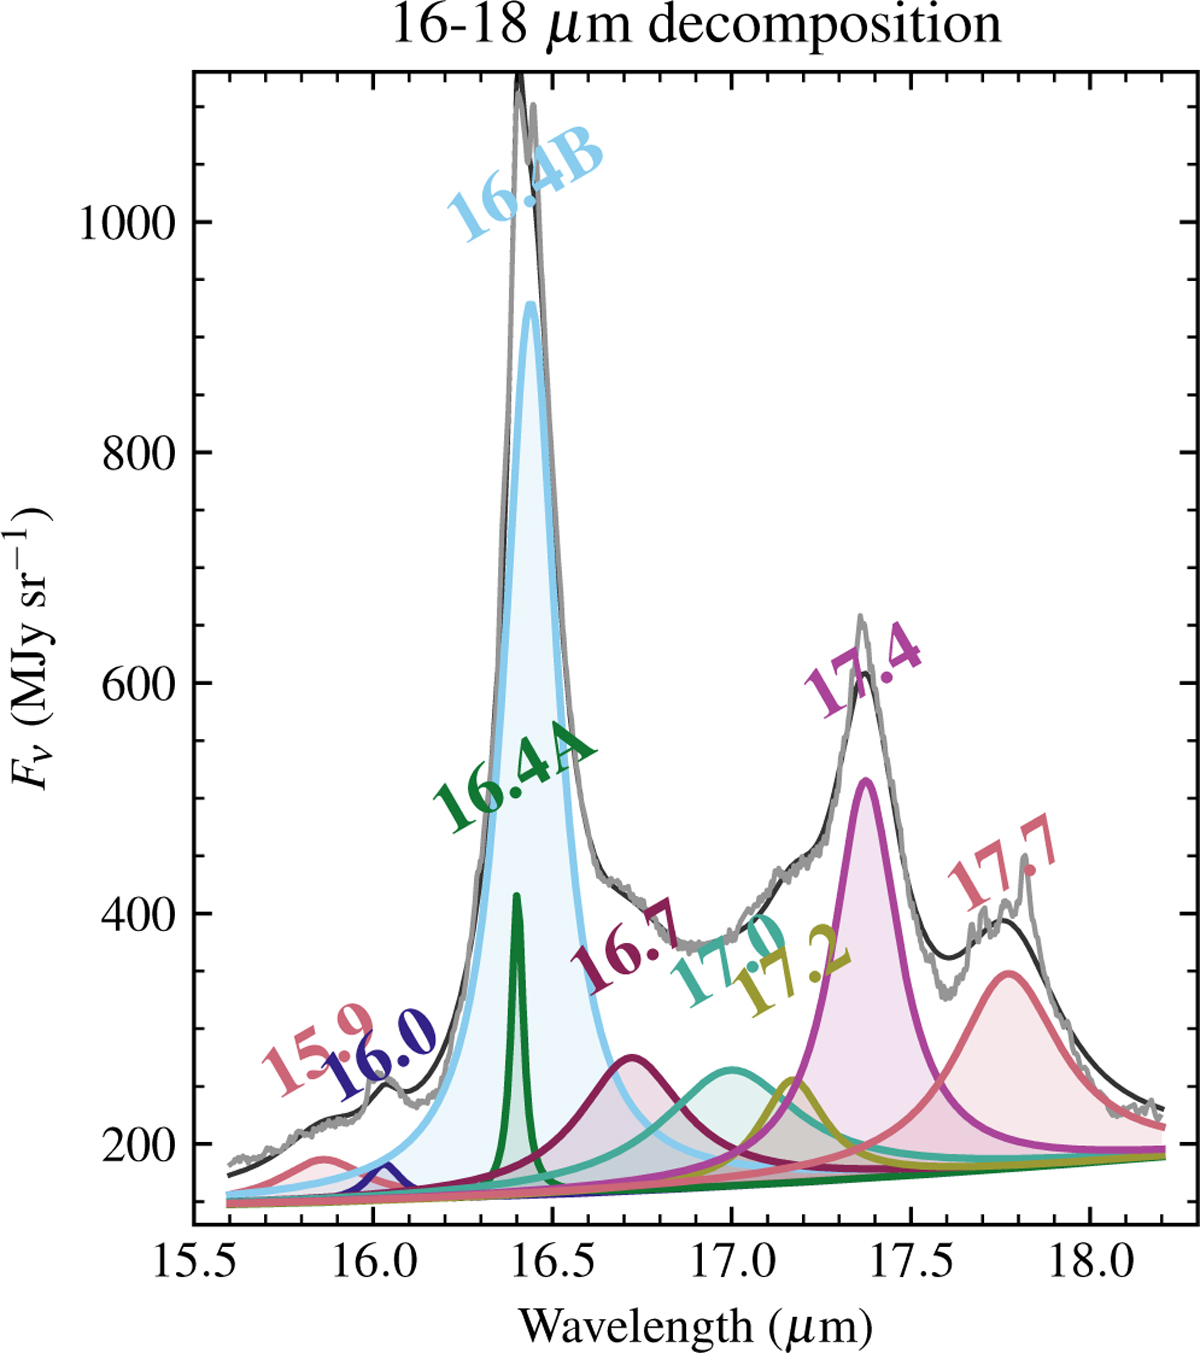
Detailed view of the updated decomposition in the 16–18 µm range. The light gray line shows the ATM spectrum, with bumps at 16.7 and 17.2 µm that raise the need for three components to model the central “plateau.” The individual Drude profiles (colorful curves and labels) are plotted after adding the continuum components, and the total model is the solid black line.
Current usage metrics show cumulative count of Article Views (full-text article views including HTML views, PDF and ePub downloads, according to the available data) and Abstracts Views on Vision4Press platform.
Data correspond to usage on the plateform after 2015. The current usage metrics is available 48-96 hours after online publication and is updated daily on week days.
Initial download of the metrics may take a while.