Fig. 6
Download original image
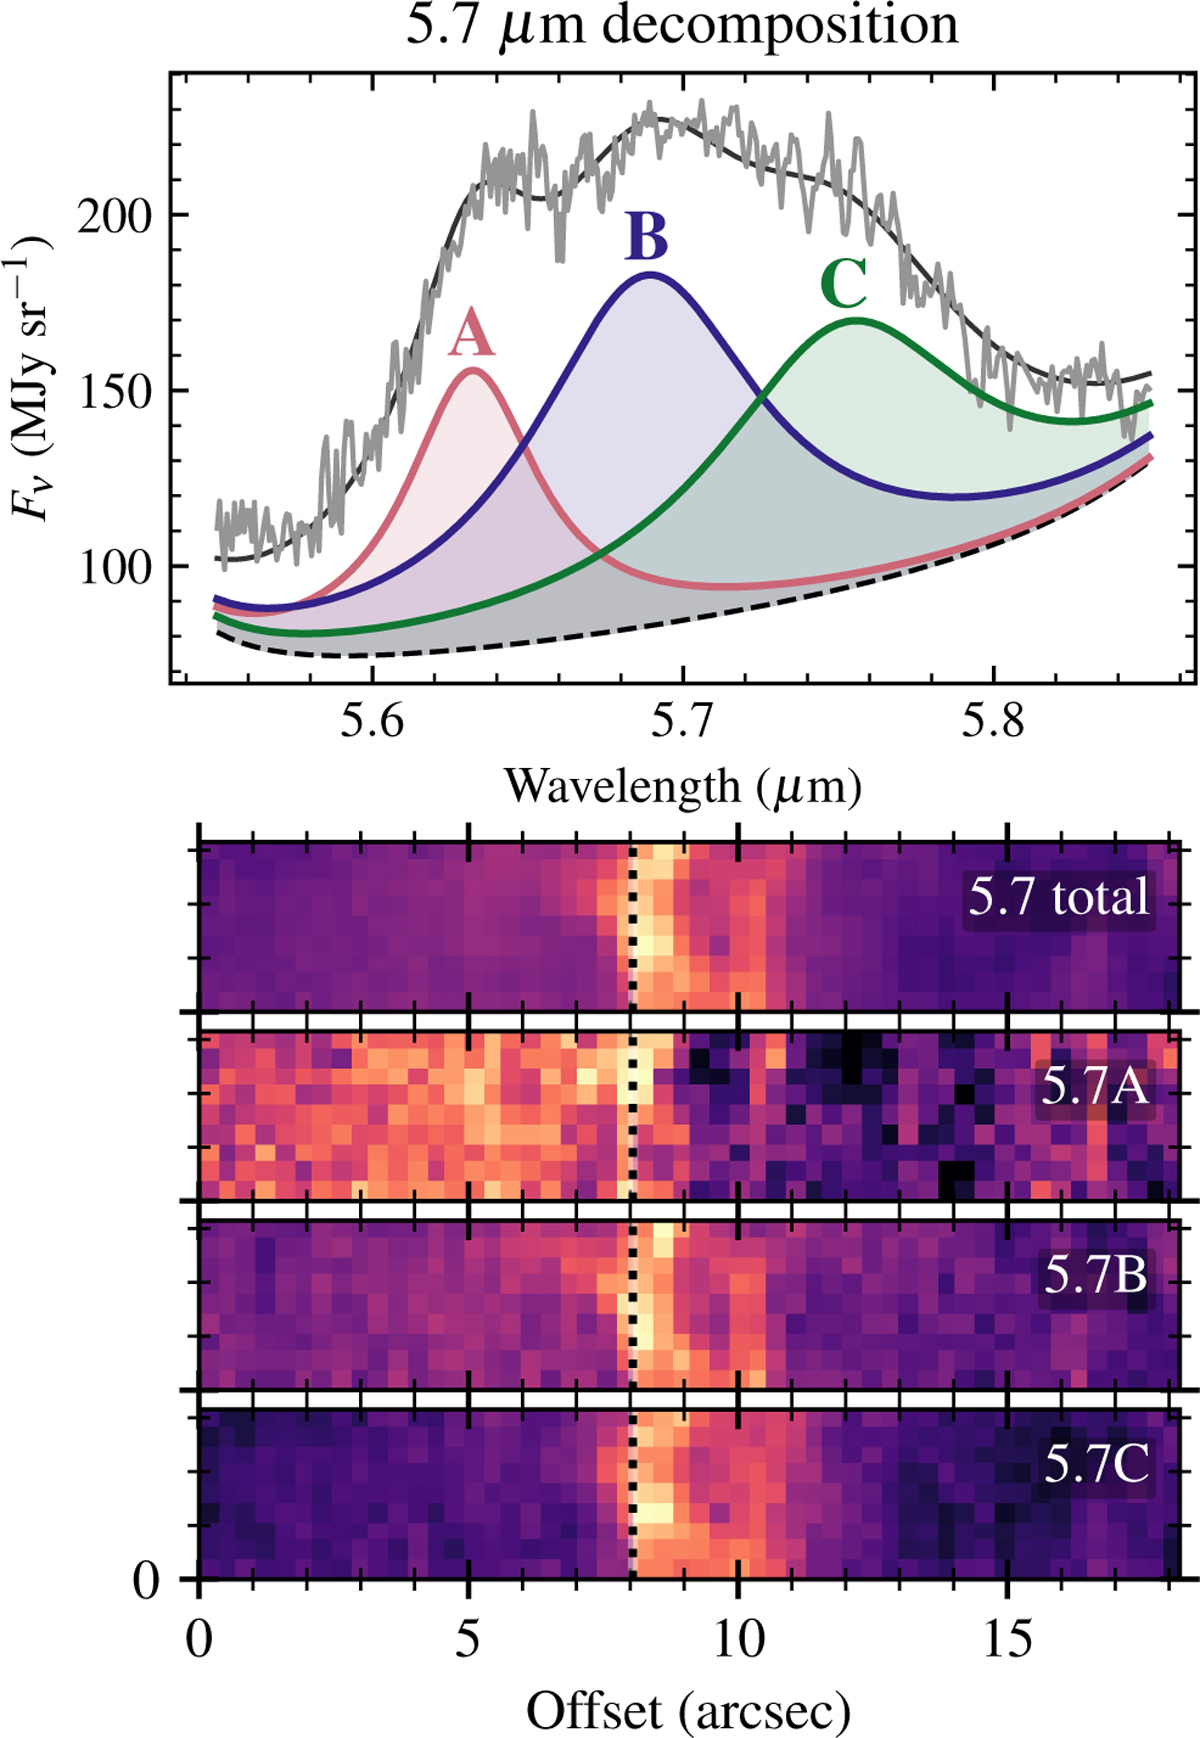
Maps of the individual components of the 5.7 µm band decomposition. The lower panel is analogous to Fig. 5. The top panel is a legend illustrating the subcomponents labeled A, B, and C. The light gray line shows the ATM spectrum data, the solid black line is the best fitting total model, and the dashed line shows the sum of all other components (continuum and wings of nearby Drude profiles), to which the three 5.7 µm components were added.
Current usage metrics show cumulative count of Article Views (full-text article views including HTML views, PDF and ePub downloads, according to the available data) and Abstracts Views on Vision4Press platform.
Data correspond to usage on the plateform after 2015. The current usage metrics is available 48-96 hours after online publication and is updated daily on week days.
Initial download of the metrics may take a while.