Open Access
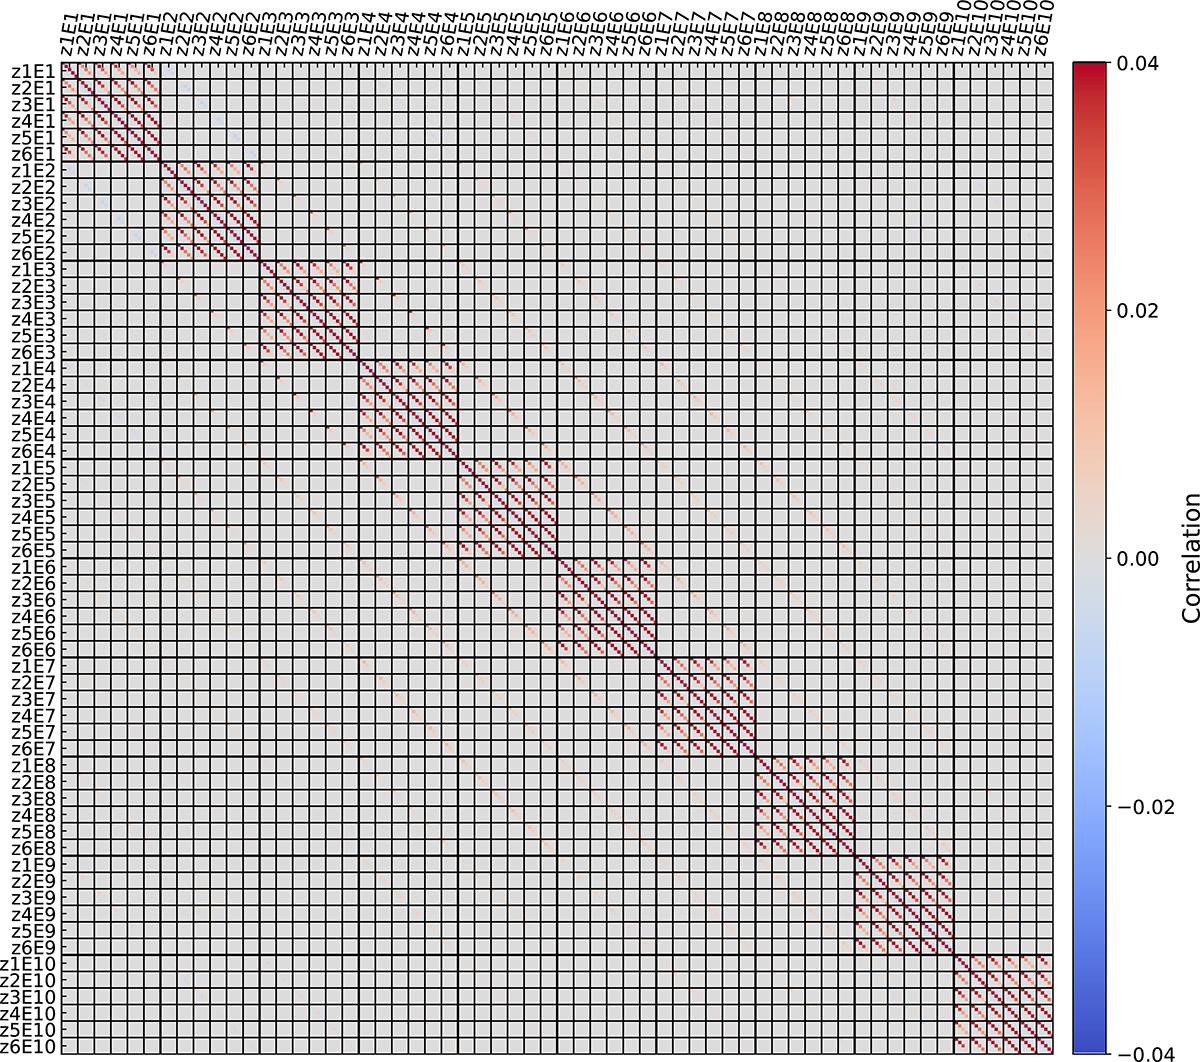
Fig. A.1.
Download original image
Correlation matrix for the cross-correlation between weak lensing data and gamma-ray intensity maps across different redshift and energy bins. The redshift bins (z1 – z6) are the six tomographic bins listed in Table 1. The energy bins (E1 – E10) span 0.5–1000 GeV from low to high energy.
Current usage metrics show cumulative count of Article Views (full-text article views including HTML views, PDF and ePub downloads, according to the available data) and Abstracts Views on Vision4Press platform.
Data correspond to usage on the plateform after 2015. The current usage metrics is available 48-96 hours after online publication and is updated daily on week days.
Initial download of the metrics may take a while.