Fig. B.1.
Download original image
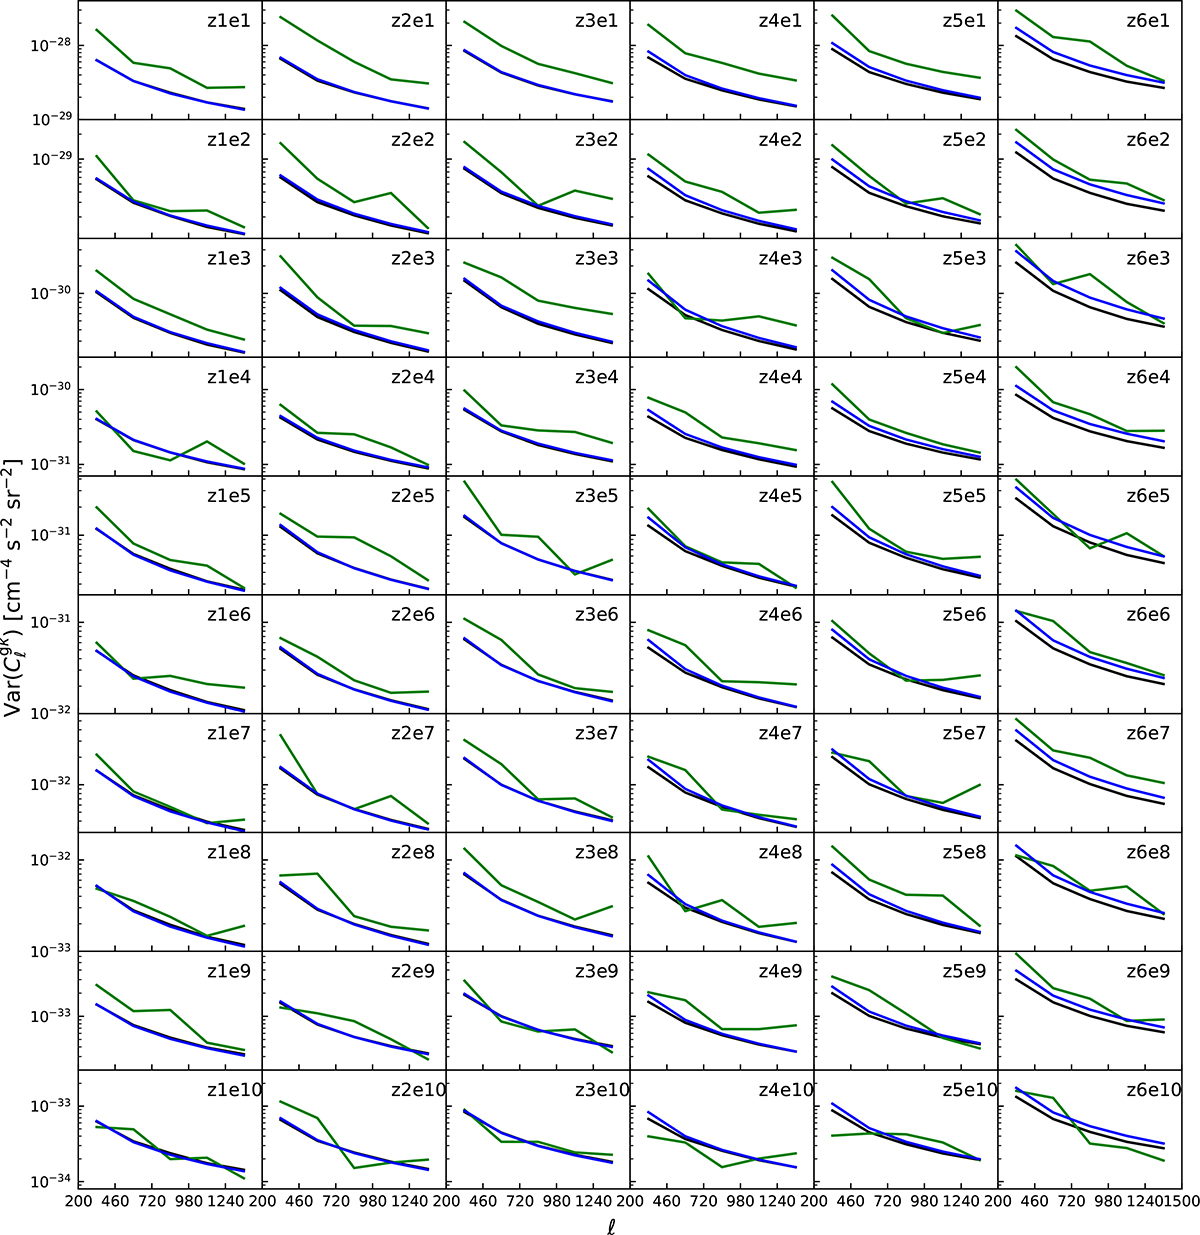
Comparison of diagonal variances for the gamma–shear cross-power spectra. Each subplot corresponds to one tomographic redshift bin (columns, from z1 to z6) and one Fermi–LAT energy bin (rows, from e1 to e10). The diagonal elements Var(Cℓgκ) are shown in the five multipole bins used in the measurement. The jackknife estimates are shown in green, the NaMaster Gaussian covariance based on analytical power spectra in blue, and that based on measured power spectra in black.
Current usage metrics show cumulative count of Article Views (full-text article views including HTML views, PDF and ePub downloads, according to the available data) and Abstracts Views on Vision4Press platform.
Data correspond to usage on the plateform after 2015. The current usage metrics is available 48-96 hours after online publication and is updated daily on week days.
Initial download of the metrics may take a while.