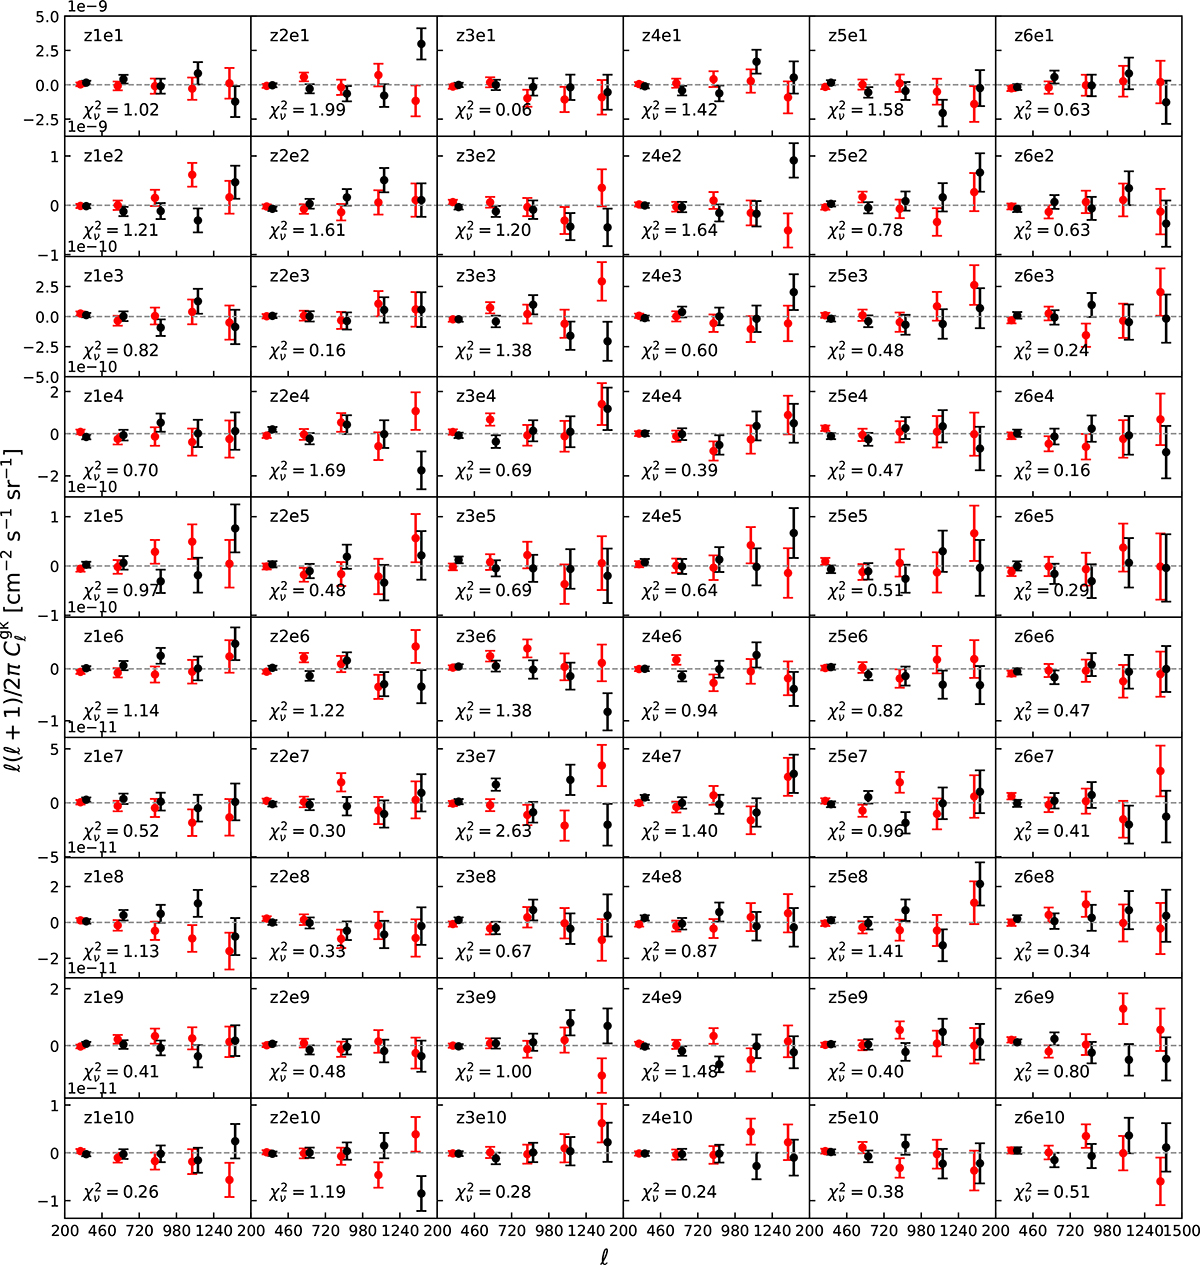
Fig. 5.
Download original image
Cross angular power spectrum Cℓgκ between the Fermi-LAT gamma-ray intensity map and KiDS-Legacy weak lensing data when using a NaMaster covariance. E- and B-mode cross-spectra are shown as black and red points, respectively. Panels are labelled by the tomographic redshift bin zi and gamma-ray energy bin Ej. The reduced χν2 (ν = 5) with respect to null signal for the E-mode in each bin is also provided in each subplot.
Current usage metrics show cumulative count of Article Views (full-text article views including HTML views, PDF and ePub downloads, according to the available data) and Abstracts Views on Vision4Press platform.
Data correspond to usage on the plateform after 2015. The current usage metrics is available 48-96 hours after online publication and is updated daily on week days.
Initial download of the metrics may take a while.