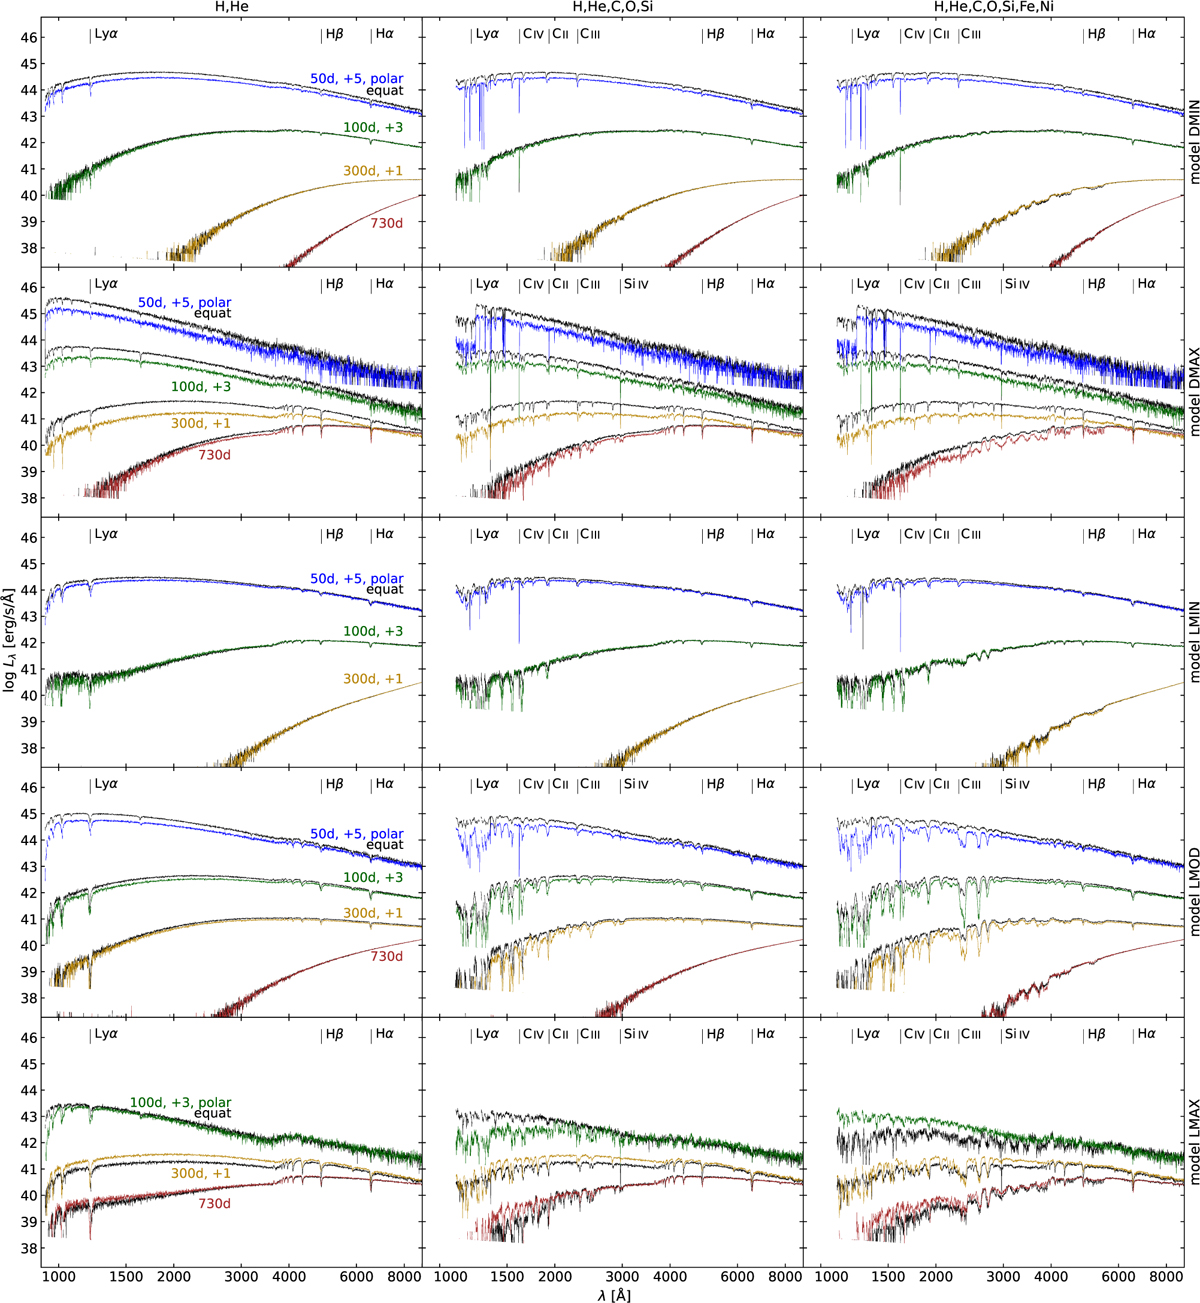
Fig. A.4
Download original image
The overall behaviour of the spectral features calculated for all models marked on the right for individual rows, using the MC-RT code SEDONA (Kasen et al. 2006) under conditions described in Sects. 2 and 5. The three columns enhance the difference between the spectra if only H and He are included (left column), some intermediate mass elements C, O, and Si are added (middle column), and Fe with Ni are added (right column). The times of particular spectra snapshots are marked directly in the image next to the corresponding graph. The coloured graphs show the spectra calculated from the direction of the pole, while the paired black graphs are calculated from an equatorial perspective. For clarity, certain pairs of spectra are shifted upwards by the positive values shown next to them. Some significant spectral lines are marked in the graph. Blends of iron lines in the right column are not marked.
Current usage metrics show cumulative count of Article Views (full-text article views including HTML views, PDF and ePub downloads, according to the available data) and Abstracts Views on Vision4Press platform.
Data correspond to usage on the plateform after 2015. The current usage metrics is available 48-96 hours after online publication and is updated daily on week days.
Initial download of the metrics may take a while.