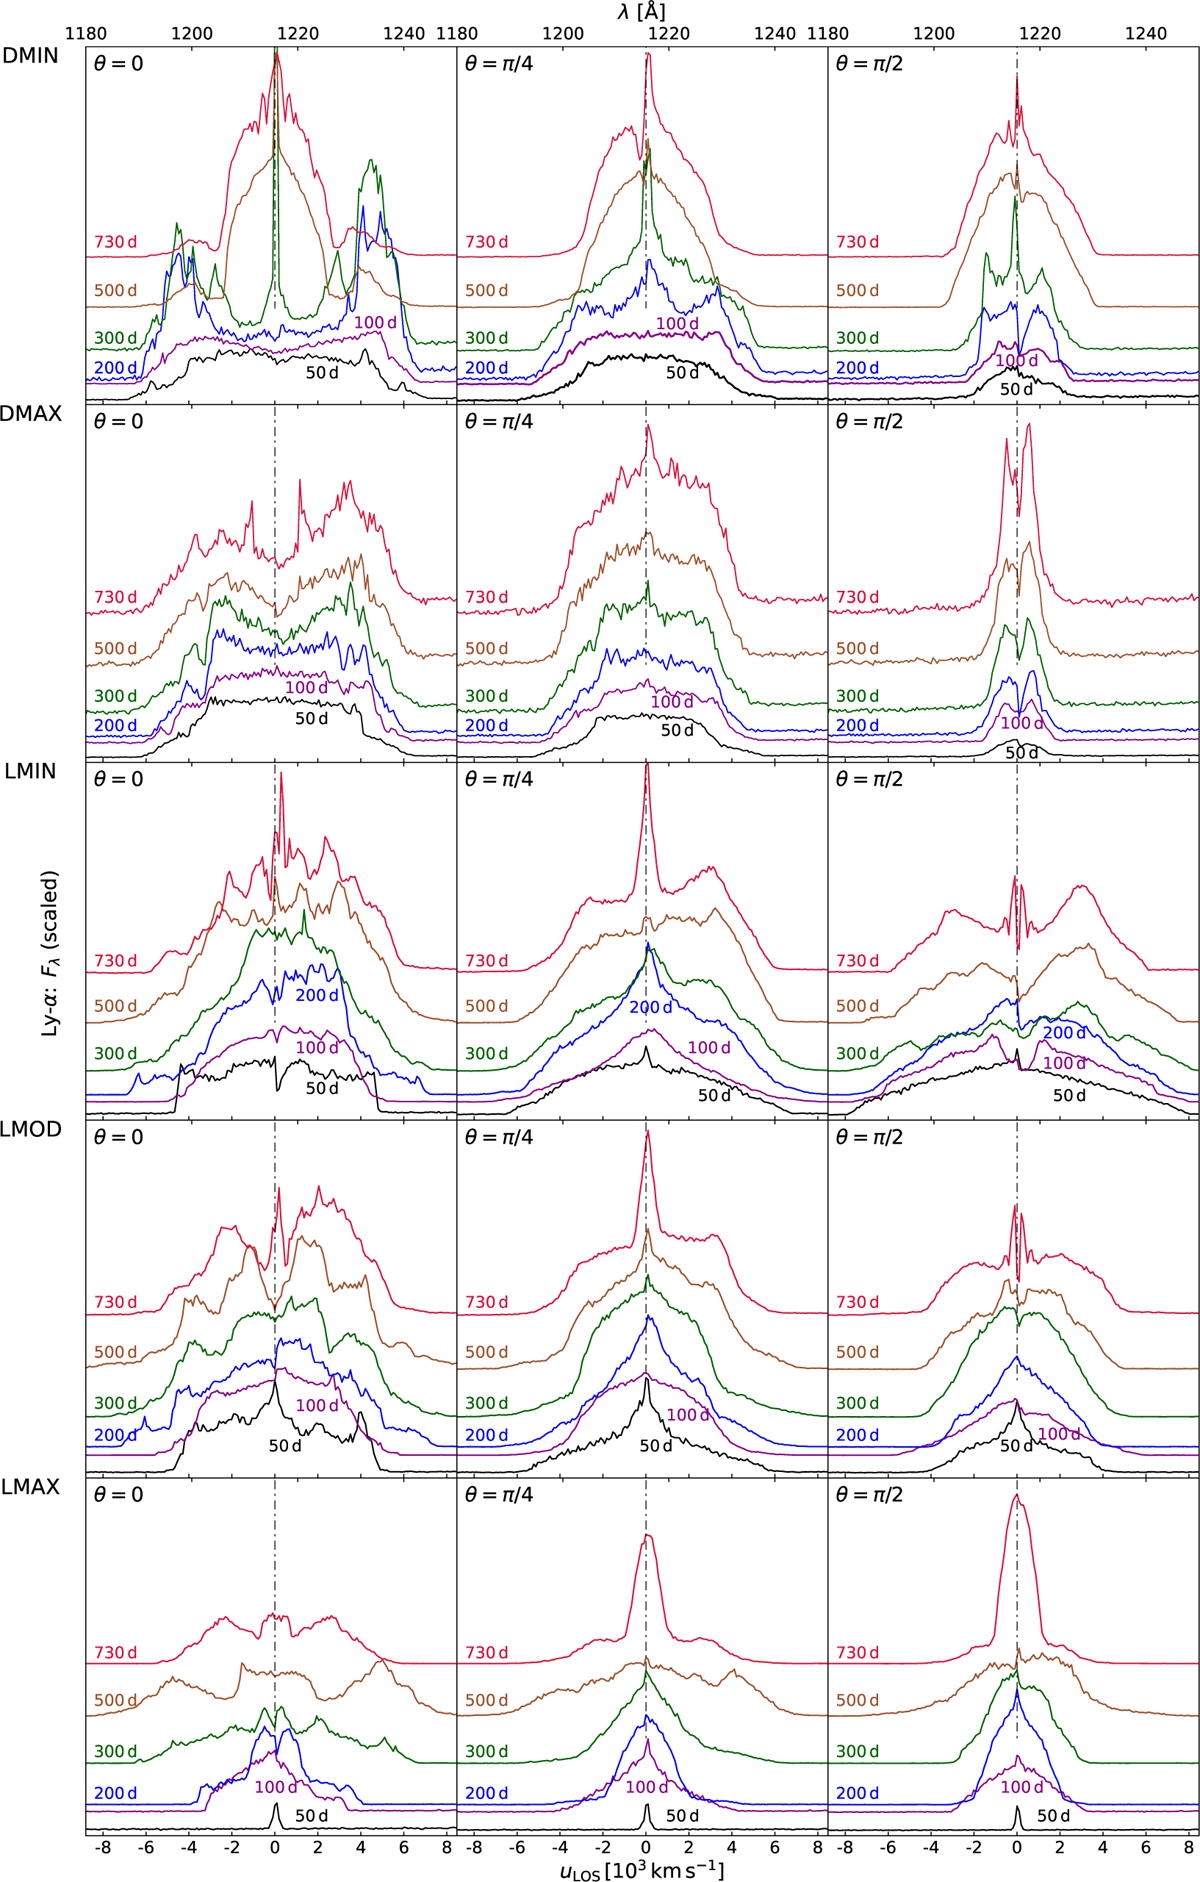
Fig. A.5
Download original image
The time evolution of a hydrogen spectral line. In this case, the detailed calculations of Ly-α line were made using the MC-RT code SIROCCO (Matthews et al. 2025) under conditions described in Sects. 2 and 5. The individual rows show a particular model, labelled on the left; each column corresponds to a different viewing polar angle θ denoted within each panel. The times of shown simulations range from 50 to 730 days with the particular time-snapshots emphasised by different colours and labelled directly in the plot. Spectral line profiles are plotted on a linear scale and normalised for clarity of presentation; for this reason, we do not display units on the vertical axis (cf. fig. 12 in PK20). The originally slightly blue-shifted peak of emission transfers after about 300-500 days to a red-shifted peak, as corresponds to observations of the spectral lines of SNe (see, e.g. Smith et al. 2015).
Current usage metrics show cumulative count of Article Views (full-text article views including HTML views, PDF and ePub downloads, according to the available data) and Abstracts Views on Vision4Press platform.
Data correspond to usage on the plateform after 2015. The current usage metrics is available 48-96 hours after online publication and is updated daily on week days.
Initial download of the metrics may take a while.