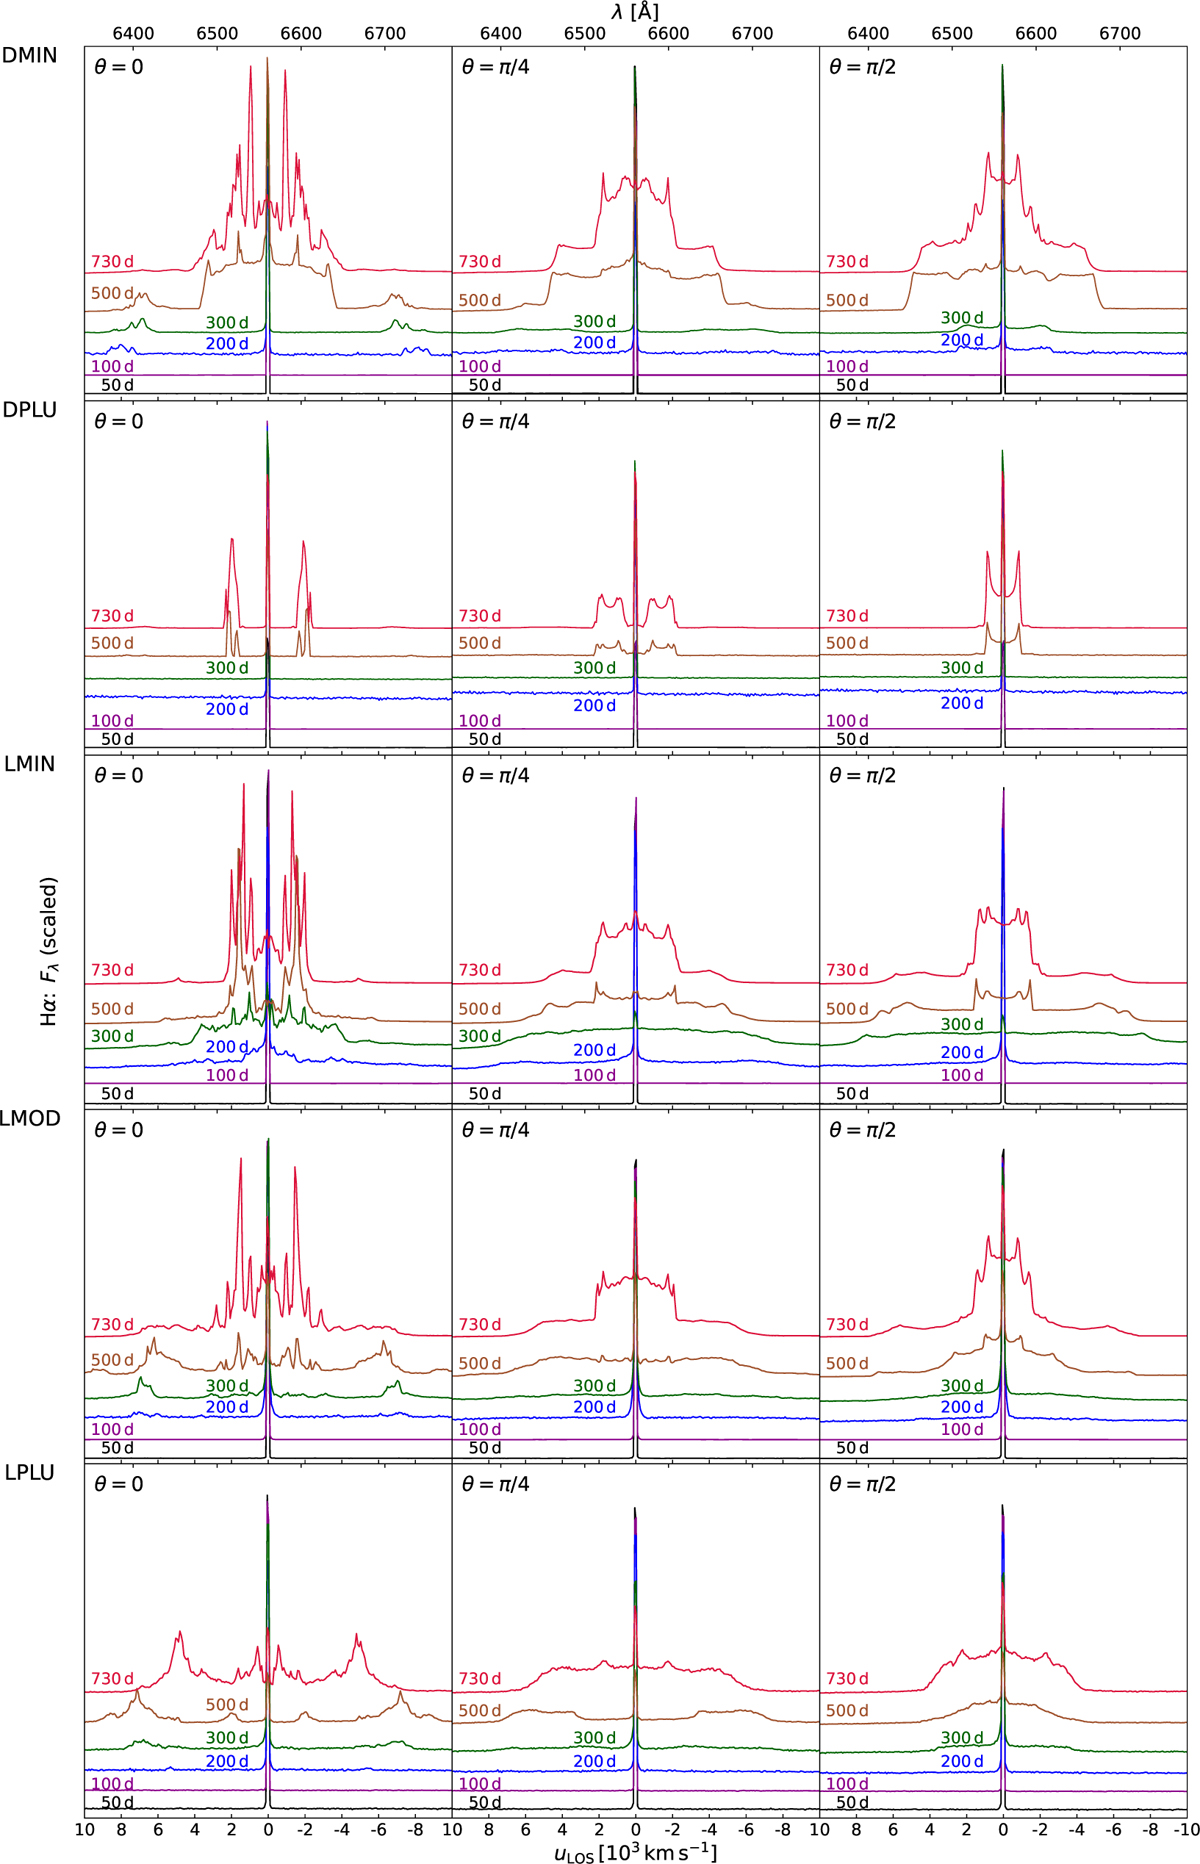
Fig. A.6
Download original image
As in Fig. A.5, now the detailed calculations of Hα line. The characteristic central emission peak is significantly narrow while the doublepeaked profile begins to appear only at later time, when the process enters the nebular phase (remarkable after some 200-300 days); the earlier profiles exhibit, except the central narrow peak, only an irregular noise within a continuum. See the further description in Sect. 5.2.
Current usage metrics show cumulative count of Article Views (full-text article views including HTML views, PDF and ePub downloads, according to the available data) and Abstracts Views on Vision4Press platform.
Data correspond to usage on the plateform after 2015. The current usage metrics is available 48-96 hours after online publication and is updated daily on week days.
Initial download of the metrics may take a while.