Fig. A.8
Download original image
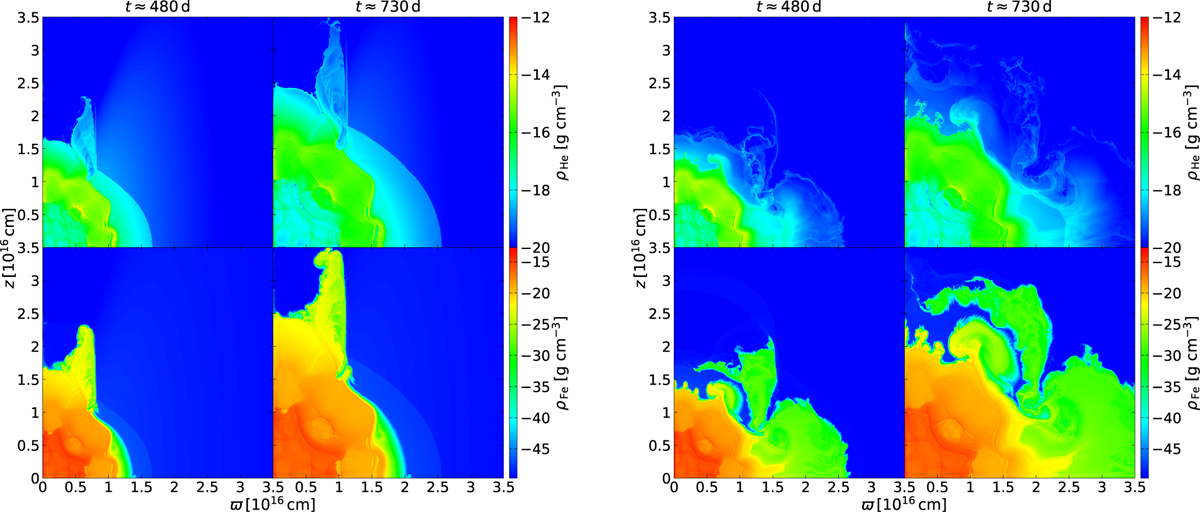
Left panel: Model DMIN. Top row : Evolution of He density at two evolved times marked in the graph. The density scaling is the same as in Fig. 1. Bottom row : Evolution of Fe density at the same two times with different scaling. Right panel: Model LMIN. Top row : Example of map of the temporal evolution of helium density at two evolved times marked in the graph. The density scaling is the same as for the total density of this model in the top row of Fig. 2. Bottom row: Map of the temporal evolution of iron density at the same two times, with significantly different density scaling.
Current usage metrics show cumulative count of Article Views (full-text article views including HTML views, PDF and ePub downloads, according to the available data) and Abstracts Views on Vision4Press platform.
Data correspond to usage on the plateform after 2015. The current usage metrics is available 48-96 hours after online publication and is updated daily on week days.
Initial download of the metrics may take a while.