Fig. 2
Download original image
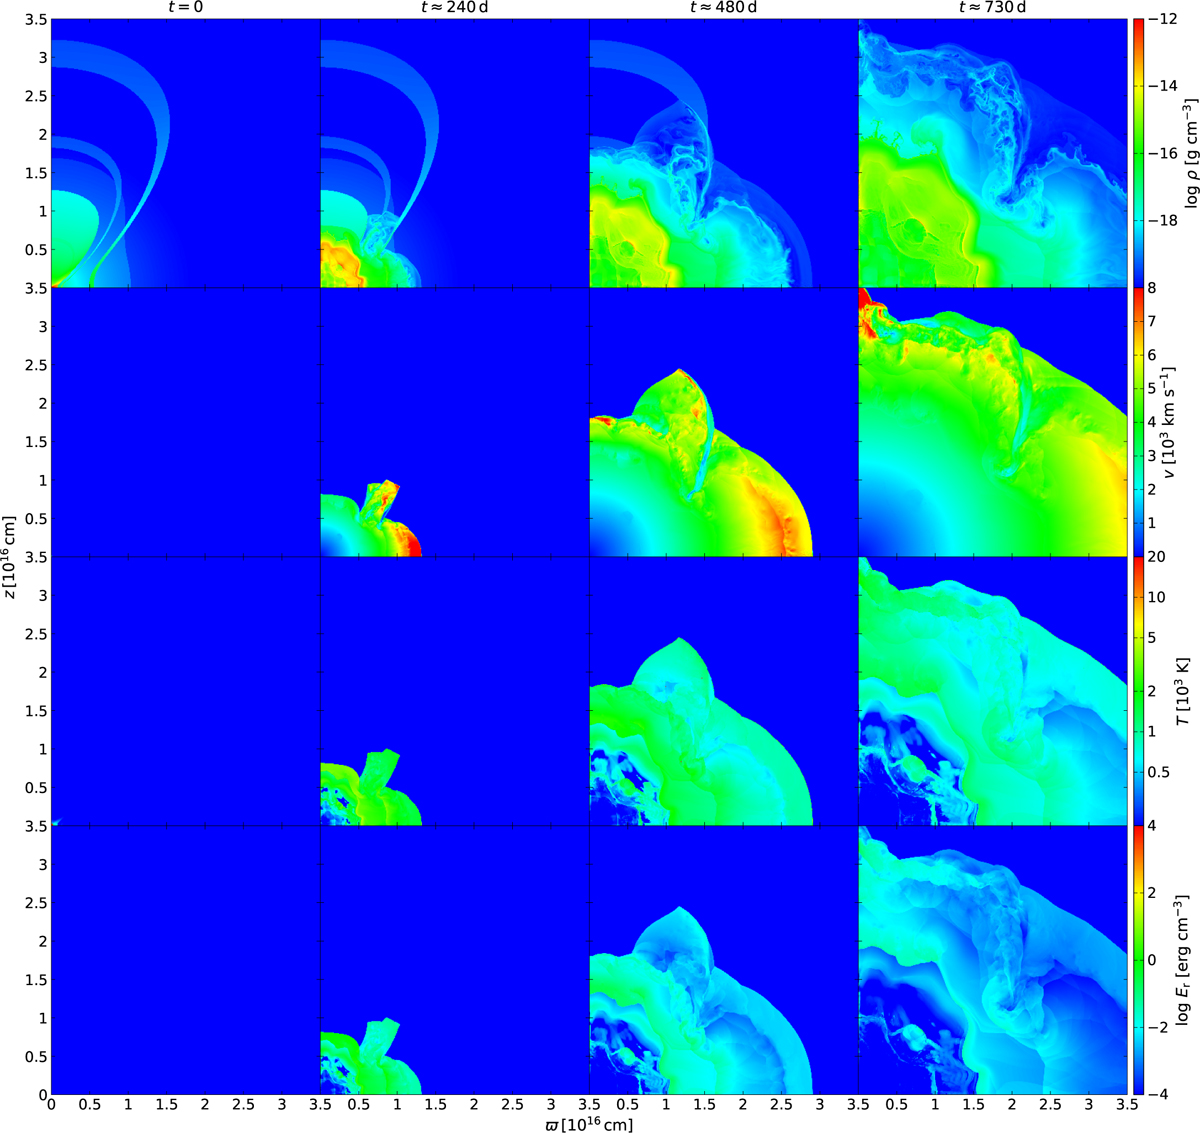
Model LMIN. Selected evolutionary stages of the SN interaction with the ’thinnest’ bipolar lobes structure calculated by the RHD code. The four columns show the snapshots at times t = 0, 240, 480, and 730 days. The individual rows show four different quantities: from top to bottom it is density ρ, velocity magnitude v, temperature T, and radiative energy density Er. The animated version of this image is available online.
Current usage metrics show cumulative count of Article Views (full-text article views including HTML views, PDF and ePub downloads, according to the available data) and Abstracts Views on Vision4Press platform.
Data correspond to usage on the plateform after 2015. The current usage metrics is available 48-96 hours after online publication and is updated daily on week days.
Initial download of the metrics may take a while.