Fig. 3
Download original image
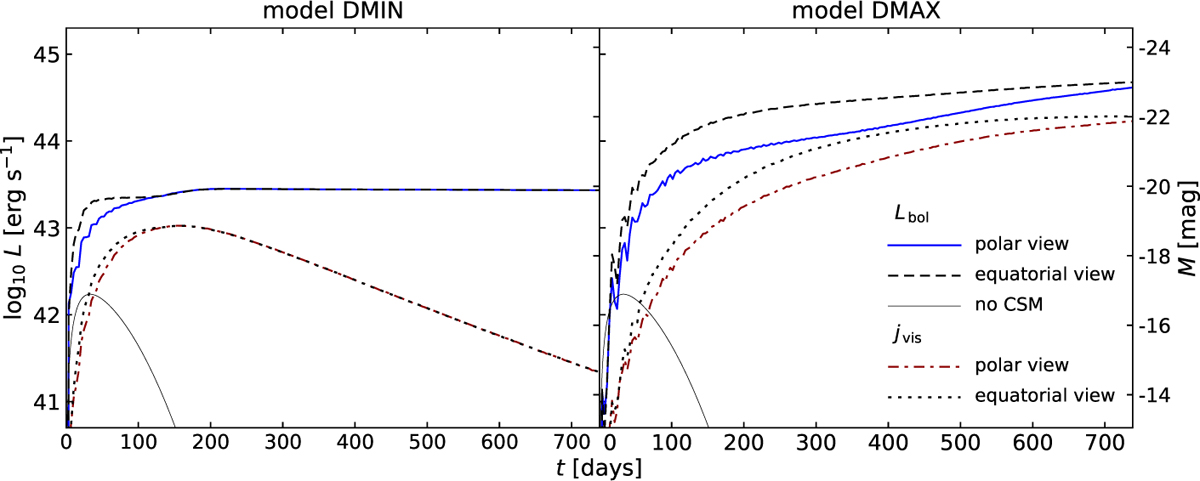
Pseudo-bolometric, directionally ‘observed’ LCs of the two models of the SN interaction with circumstellar disc-like structures, denoted as model DMIN (left panel) and model DMAX (right panel), up to approximately 2 years (see Sects. 3.1 and 4.1). The upper pair of lines shows the LCs calculated within the ’largest’ frequency range 1014-2 × 10¹⁶ Hz (see Sect. 2.4), while the bottom pair of lines shows the same within the range (3.875-7.825) × 1014 Hz, which roughly corresponds to the frequency range of visible light (for LCs corresponding to AB magnitudes in main filters, see Fig. 4). We demonstrate here the LC profiles for two different viewing angles in the graphs, the pole-on (polar) view marked in blue and the equatorial view marked in dashed black line for the bolometric LC (labelled Lbol in the legend), and the polar view marked in red dash-dotted line and the equatorial view marked in dotted black line for the visual LC (labelled jvis in the legend). The black solid line labelled ’no CSM’ corresponds to an SN without CSM interaction, heated with 0.28 M⊙ of radioactive Ni which roughly corresponds to the brightest normal H-rich SNe (Pejcha & Prieto 2015; Müller et al. 2017) or the population mean of stripped SNe (Anderson 2019).
Current usage metrics show cumulative count of Article Views (full-text article views including HTML views, PDF and ePub downloads, according to the available data) and Abstracts Views on Vision4Press platform.
Data correspond to usage on the plateform after 2015. The current usage metrics is available 48-96 hours after online publication and is updated daily on week days.
Initial download of the metrics may take a while.