Fig. 7
Download original image
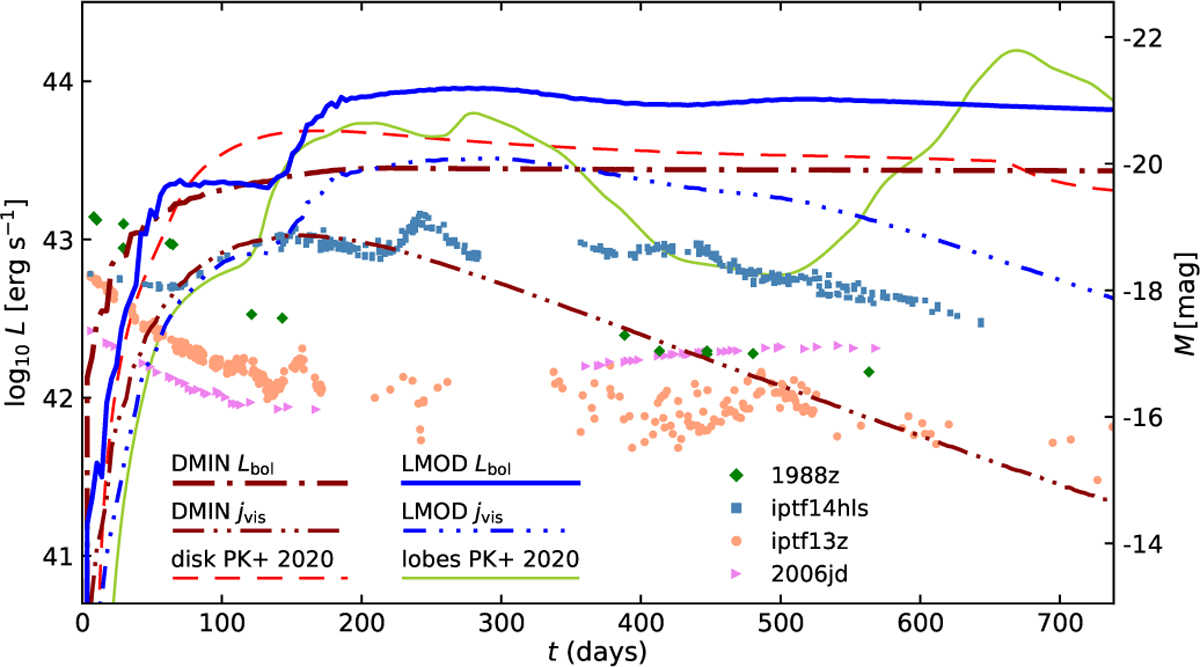
Bolometric and visual LCs of selected models. The thick blue and brown lines show the numerically calculated pole-on viewed LCs of the models DMIN and LMOD (cf. Figs. 3 and 5). The red and green lines show the LCs of the SN-disc and SN-lobes interactions calculated semi-analytically in PK20. The graph compares the synthetic LCs from our models calculated as a ‘first iteration’ within the planned ‘chain’ of models with the observed LCs of strongly interacting SNe of type IIn, SN1988Z (Aretxaga et al. 1999), iPTF14hls (Arcavi et al. 2017), iPTF13z (Nyholm et al. 2017), and 2006jd (Stritzinger et al. 2012), shown with points.
Current usage metrics show cumulative count of Article Views (full-text article views including HTML views, PDF and ePub downloads, according to the available data) and Abstracts Views on Vision4Press platform.
Data correspond to usage on the plateform after 2015. The current usage metrics is available 48-96 hours after online publication and is updated daily on week days.
Initial download of the metrics may take a while.