Fig. 1
Download original image
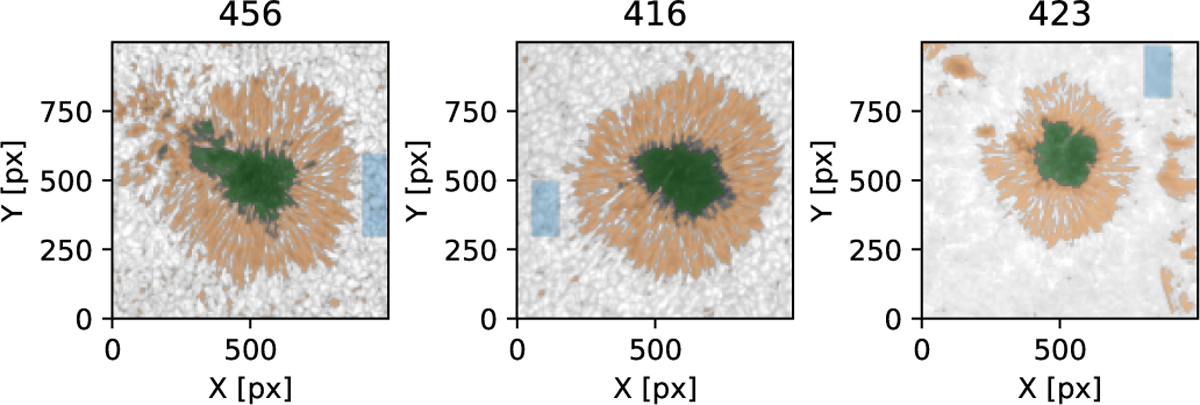
High-resolution sunspot images corresponding to the datasets shown in Table 1. The highlighted quiet Sun (blue), penumbra (orange), and umbra (green) regions were obtained with intensity thresholds. Pixels within the highlighted regions have been averaged into their respective spectral profile. The images are of the continuum left of Fe I 6173 A, Fe 16302 A, and the Hα pseudo-continuum. All figures have an observed resolution of 0.058″/pixel.
Current usage metrics show cumulative count of Article Views (full-text article views including HTML views, PDF and ePub downloads, according to the available data) and Abstracts Views on Vision4Press platform.
Data correspond to usage on the plateform after 2015. The current usage metrics is available 48-96 hours after online publication and is updated daily on week days.
Initial download of the metrics may take a while.