Fig. 2
Download original image
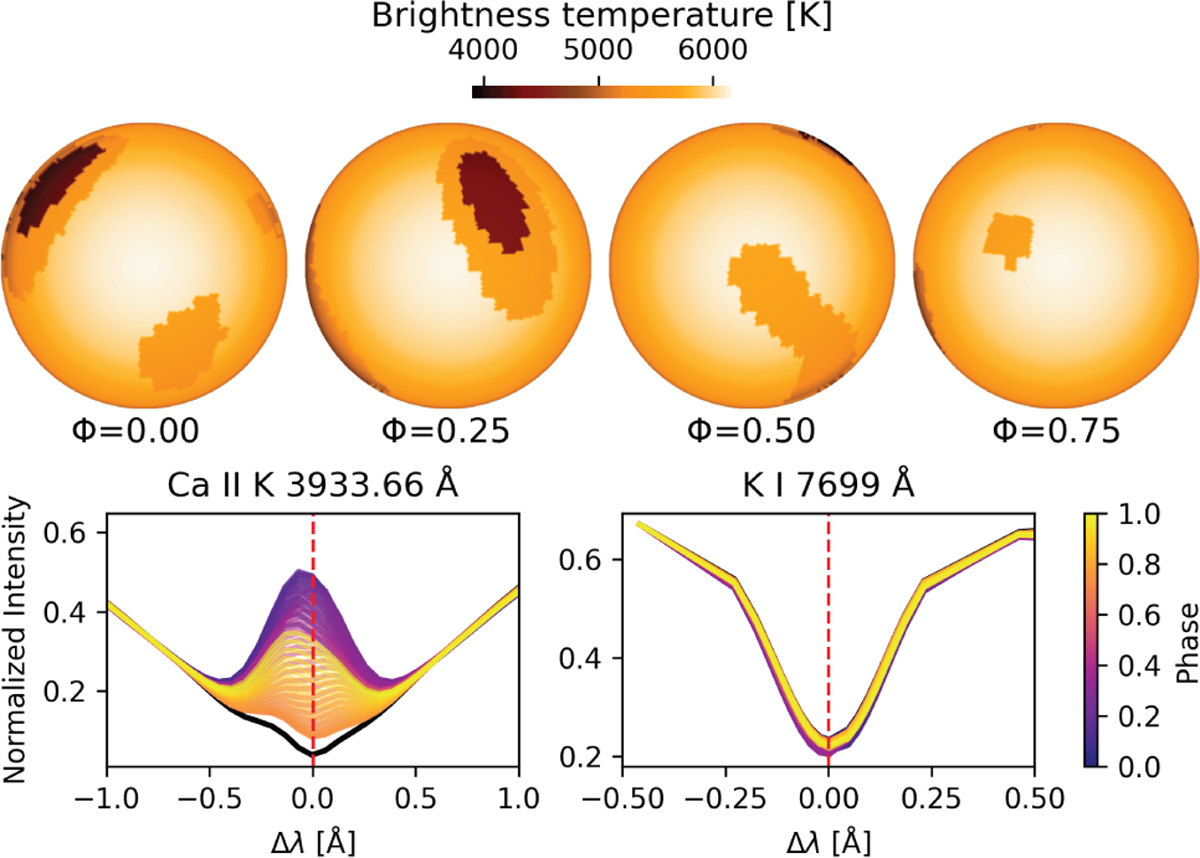
Simulated stellar disks and their profiles. Top: four resolved NESSI disk brightness temperature maps based on the provided Doppler imaging map with distinct umbra, penumbra, and quiet Sun regions as well as applied limb darkening. From left to right, the phases are 0, 0.25, 0.5, and 0.75. Bottom: resulting spectra for Ca II K and K I 7699 A for all phases (colored) and the disk with no spots (black). The red dashed lines denote the rest wavelength of the line.
Current usage metrics show cumulative count of Article Views (full-text article views including HTML views, PDF and ePub downloads, according to the available data) and Abstracts Views on Vision4Press platform.
Data correspond to usage on the plateform after 2015. The current usage metrics is available 48-96 hours after online publication and is updated daily on week days.
Initial download of the metrics may take a while.