Open Access
Fig. 4
Download original image
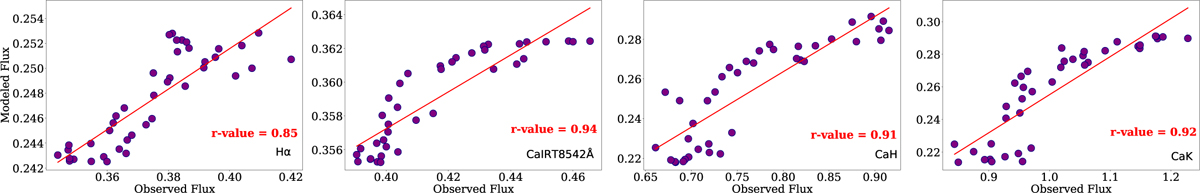
Flux correlations between the observed and the modeled values. The red line shows the linear fit for the given chromospheric emissions. The r-values indicate the spearman correlation coefficients for the given measurements.
Current usage metrics show cumulative count of Article Views (full-text article views including HTML views, PDF and ePub downloads, according to the available data) and Abstracts Views on Vision4Press platform.
Data correspond to usage on the plateform after 2015. The current usage metrics is available 48-96 hours after online publication and is updated daily on week days.
Initial download of the metrics may take a while.