Fig. A.1
Download original image
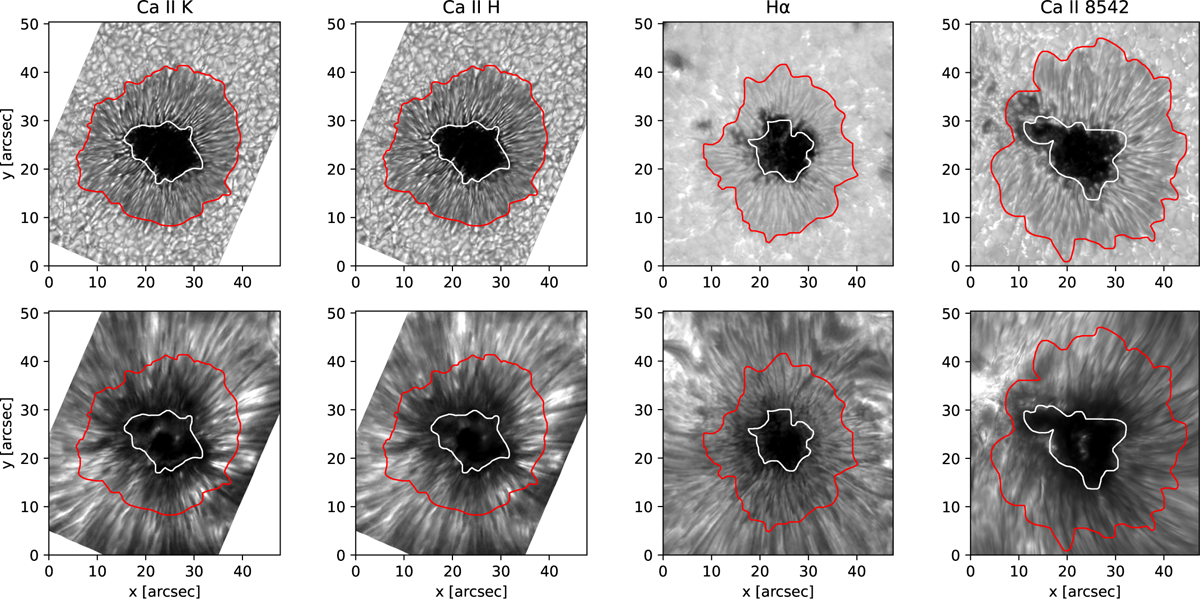
Sunspots used for the chromospheric-line analysis. Upper panel: Line-wing images showing the (pseudo-)photospheric appearance of the spots. Contours derived from intensity thresholds outline the umbra (white) and penumbra (red). Lower panel: Same fields of view shown in the respective line cores, probing the chromosphere at different heights. The same contours are overplotted to highlight the chromospheric contrast of the umbra, penumbra, and surrounding quiet Sun.
Current usage metrics show cumulative count of Article Views (full-text article views including HTML views, PDF and ePub downloads, according to the available data) and Abstracts Views on Vision4Press platform.
Data correspond to usage on the plateform after 2015. The current usage metrics is available 48-96 hours after online publication and is updated daily on week days.
Initial download of the metrics may take a while.