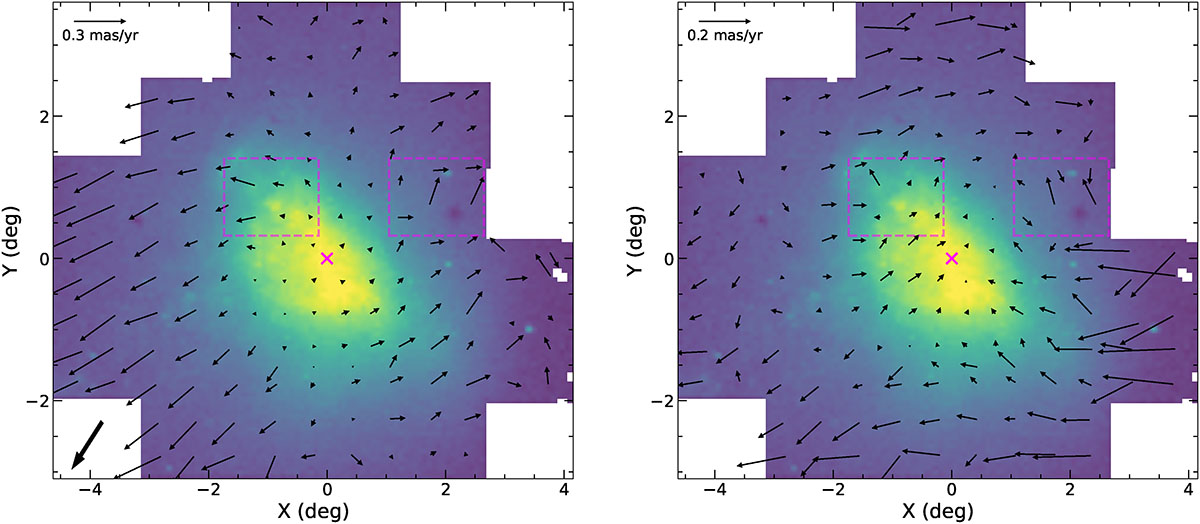
Fig. 1.
Download original image
Residual proper motion maps projected onto the sky plane. Left: Motion of SMC stars after subtraction of the bulk systemic motion (bold arrow). Right: Motion of SMC stars after subtraction of a best-fitting linear velocity gradient from the residual motion shown in the left panel. The background shows the density of probable SMC sources in the VMC–Gaia EDR3 cross-matched catalogue. The red dashed boxes indicate tiles SMC 5_4 and SMC 5_2 (left to right), and the optical centre is marked by a red cross. A reference vector at the top left indicates the velocity scale. East is to the left and north is at the top.
Current usage metrics show cumulative count of Article Views (full-text article views including HTML views, PDF and ePub downloads, according to the available data) and Abstracts Views on Vision4Press platform.
Data correspond to usage on the plateform after 2015. The current usage metrics is available 48-96 hours after online publication and is updated daily on week days.
Initial download of the metrics may take a while.