Fig. 5
Download original image
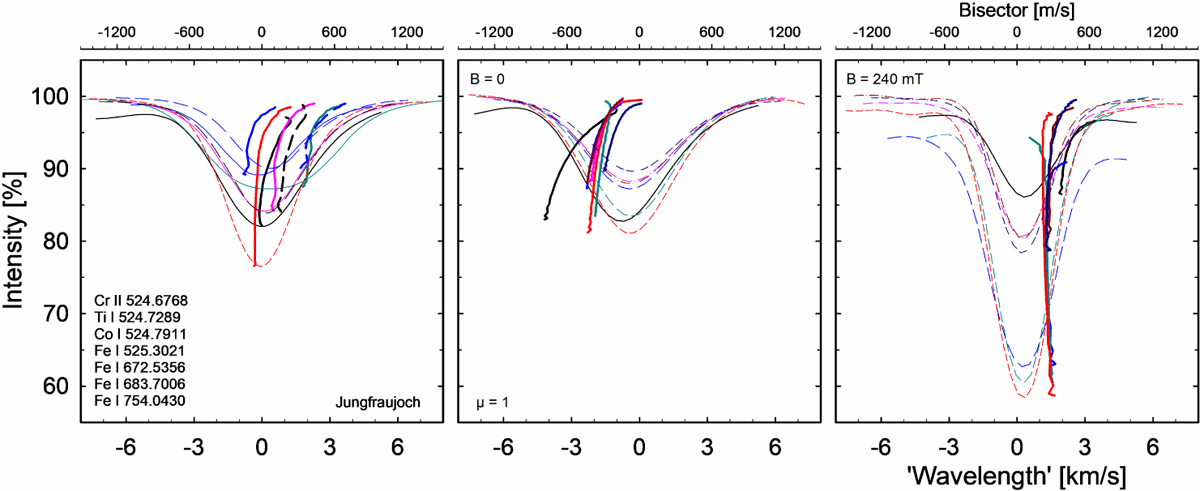
Weak lines at solar disk center, μ = 1. Shown are the line profiles and bisectors from the Jungfraujoch atlas (left). Numerous lines of comparable strength show similar behavior in both the nonmagnetic case (center) and in the 240 mT = 2400 G magnetic simulation (right). Wavelengths in observational atlases are affected by the solar gravitational redshift of 635 m s−1 and possible errors in laboratory wavelengths.
Current usage metrics show cumulative count of Article Views (full-text article views including HTML views, PDF and ePub downloads, according to the available data) and Abstracts Views on Vision4Press platform.
Data correspond to usage on the plateform after 2015. The current usage metrics is available 48-96 hours after online publication and is updated daily on week days.
Initial download of the metrics may take a while.