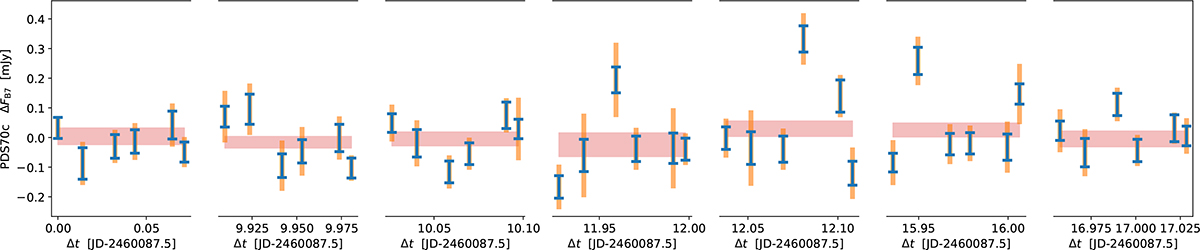
Fig. D.3.
Download original image
Same as Fig. 2, but for the fine-grained IB23 dataset, splitting each EB into 6 intervals. The blue error bars stem from the statwt visibility weights, while the orange bars stem from the spatial scatter. The coarser measurements shown in transparent red boxes, with total vertical extension of 2σ, are reproduced from Fig. D.2, and correspond to extractions over the full EB.
Current usage metrics show cumulative count of Article Views (full-text article views including HTML views, PDF and ePub downloads, according to the available data) and Abstracts Views on Vision4Press platform.
Data correspond to usage on the plateform after 2015. The current usage metrics is available 48-96 hours after online publication and is updated daily on week days.
Initial download of the metrics may take a while.