Fig. 2
Download original image
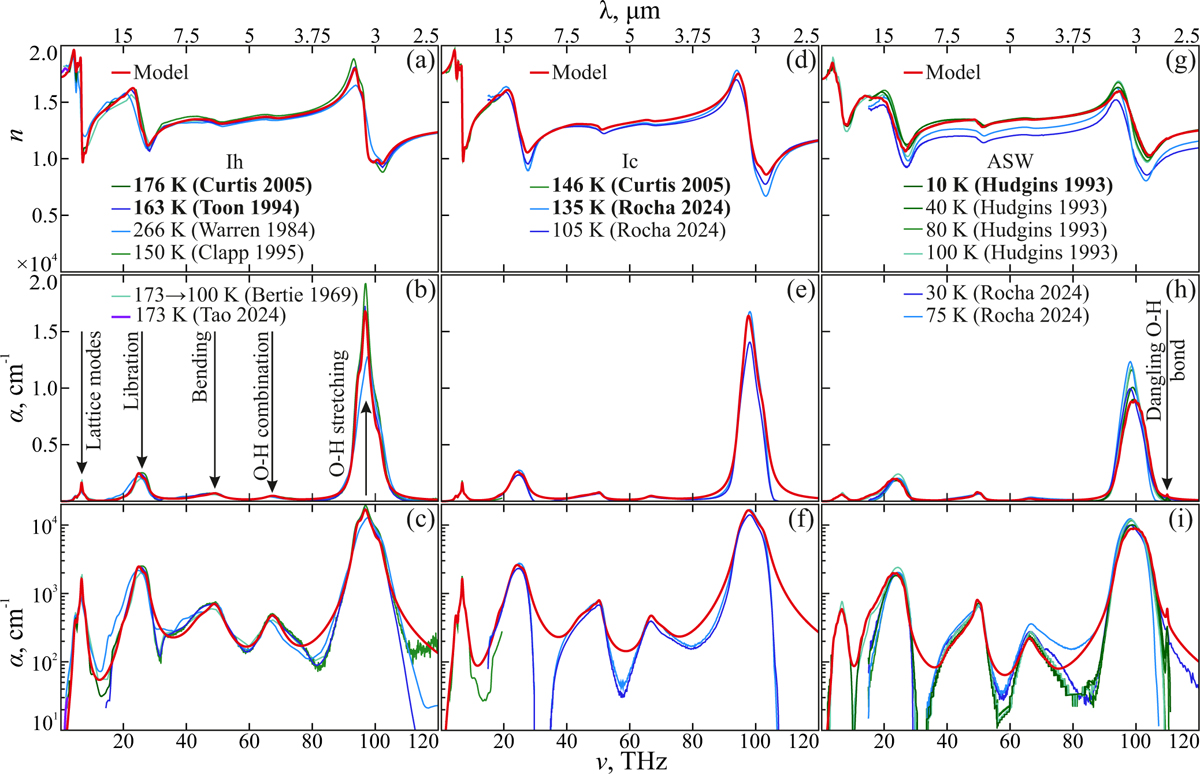
Literature data on the broadband (THz-IR) optical properties of H2O ices as compared to the inferred model (Eq. (3) and Appendix A, Tables A.1-A.3). (a)-(c): literature data on the refractive index n and absorption coefficient α (by field, in both the linear and logarithmic scale), respectively, for the Ih ice overlapped with the model. The legend indicates the ice deposition (or warming-up) temperature and the corresponding reference. The bold text denotes the densest ice samples. The vertical arrows indicate the absorption bands assigned to the different vibrational modes. (d)-(f) and (g)-(i): similar datasets for the Ic and ASW ices, respectively.
Current usage metrics show cumulative count of Article Views (full-text article views including HTML views, PDF and ePub downloads, according to the available data) and Abstracts Views on Vision4Press platform.
Data correspond to usage on the plateform after 2015. The current usage metrics is available 48-96 hours after online publication and is updated daily on week days.
Initial download of the metrics may take a while.