Fig. 3
Download original image
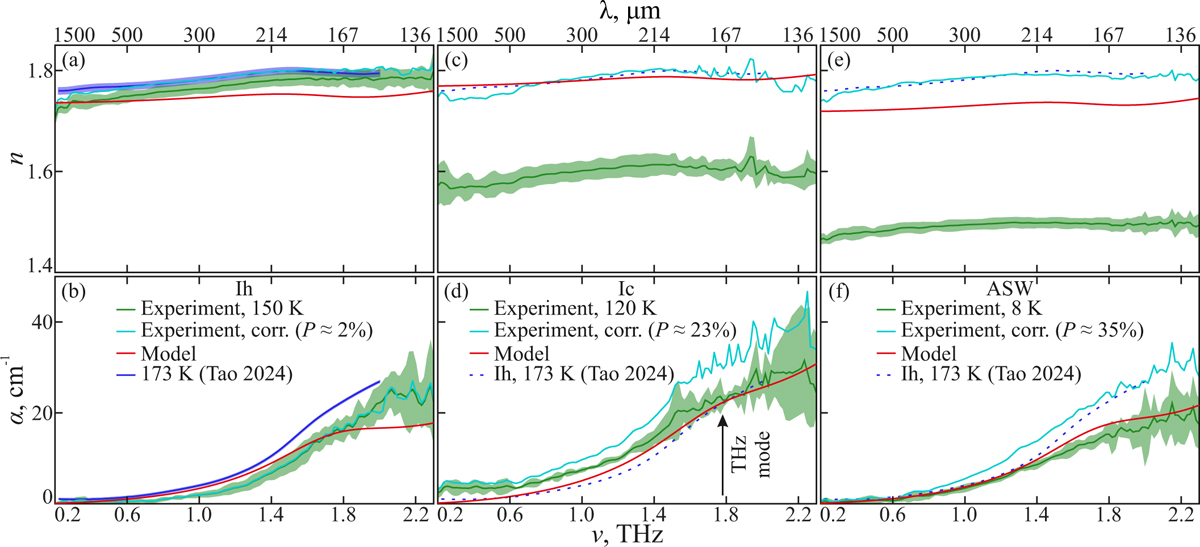
Experimental (this work) and literature data on the THz optical properties of H2O ices as compared to the inferred model (Eq. (3) and Appendix A, Tables A.1-A.3). (a),(b): measured refractive index (n) and absorption coefficient (α; by field), respectively, for the Ih ice overlapped with the data by Tao et al. (2024) and the model. The legend indicates the ice deposition temperature and the corresponding reference. The blue curves show the experimental data corrected by the Bruggeman model (Eq. (2)) to exclude the P = 2% ice porosity (in comparison to data by Tao et al. (2024) as detailed by Gavdush et al. (2025). (c),(d) and (e),(f): similar datasets for the Ic and ASW ices, respectively. In the absence of relevant data in the literature, the data for Ih and ASW ices are also compared with those (dashed curves) for Ih ice by Tao et al. (2024), with the resultant porosity values constituting P = 23 and 35% for our Ih and ASW samples, respectively.
Current usage metrics show cumulative count of Article Views (full-text article views including HTML views, PDF and ePub downloads, according to the available data) and Abstracts Views on Vision4Press platform.
Data correspond to usage on the plateform after 2015. The current usage metrics is available 48-96 hours after online publication and is updated daily on week days.
Initial download of the metrics may take a while.