Fig. 6
Download original image
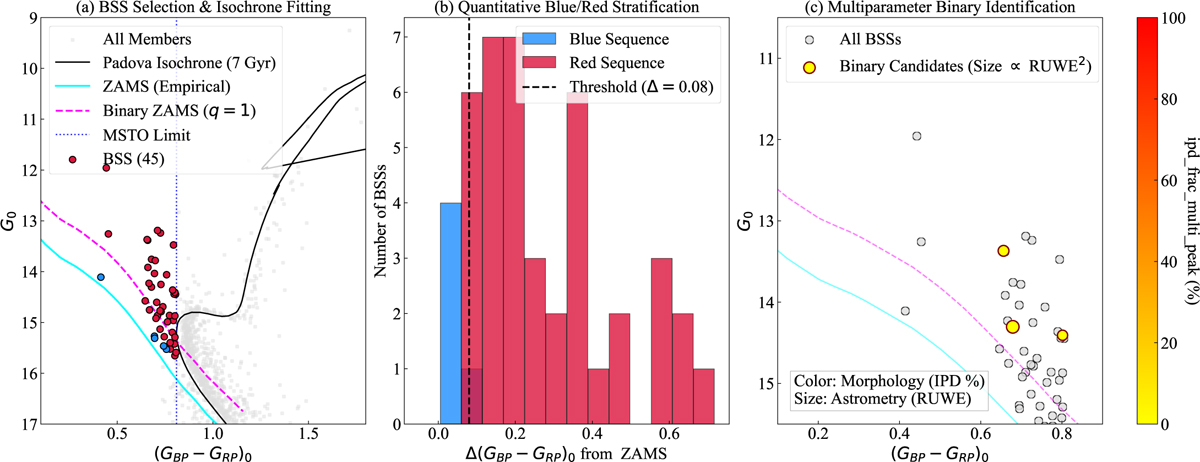
Comprehensive analysis of the BSS population. Panel a: CMD showing the BSS selection box relative to the Padova isochrone and the empirical M67 ZAMS. Panel b: histogram of color offsets from the ZAMS, defining the blue and red sequences. Panel c: multiparameter binary identification matrix. Circle sizes are proportional to square of RUWE, and colors represent the image morphology (ipd_frac_multi_peak).
Current usage metrics show cumulative count of Article Views (full-text article views including HTML views, PDF and ePub downloads, according to the available data) and Abstracts Views on Vision4Press platform.
Data correspond to usage on the plateform after 2015. The current usage metrics is available 48-96 hours after online publication and is updated daily on week days.
Initial download of the metrics may take a while.