Fig. 6
Download original image
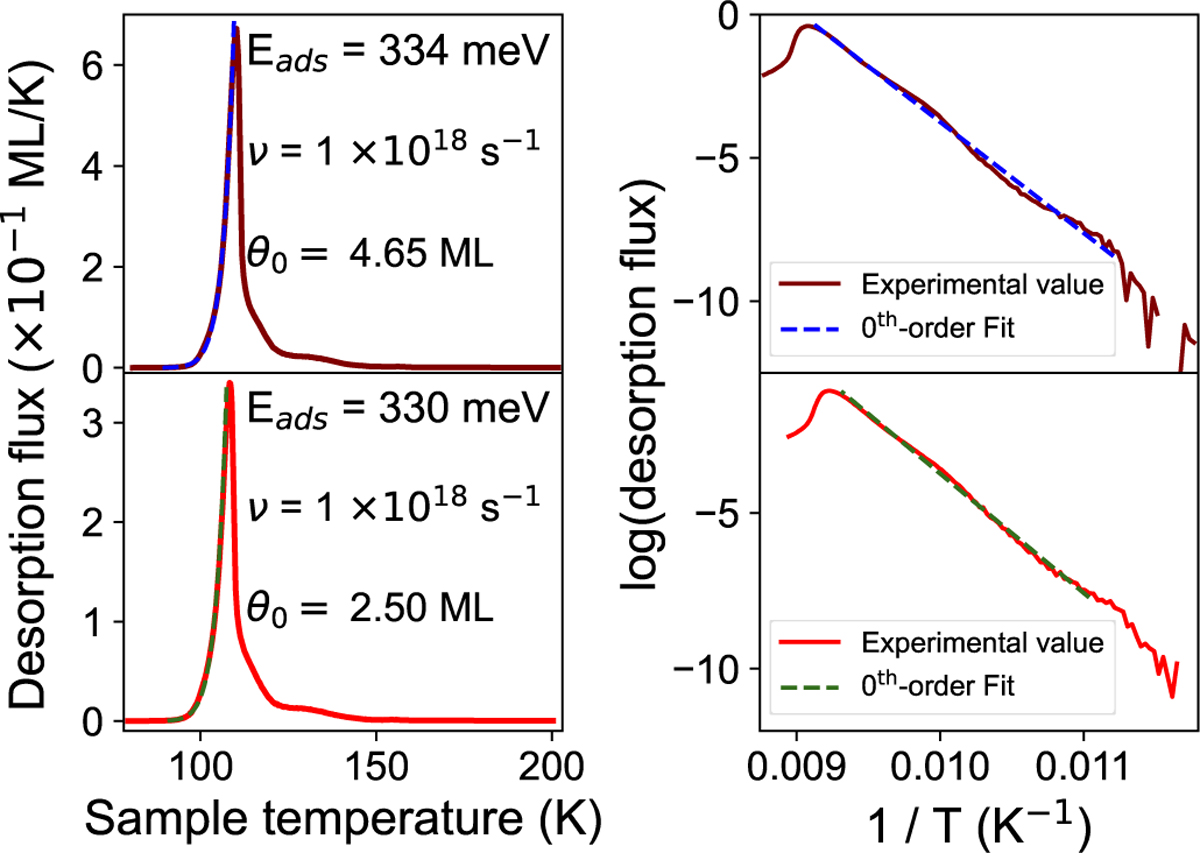
(Left) TPD curves of SO2 deposited at 80 K on c-ASW at different coverages (brown curve, 4.65 ML; red curve, 2.50 ML) in the multilayer regime, together with the corresponding zeroth-order fits (dashed blue and green lines, respectively). (Right) Logarithm of the corresponding TPD curves as a function of the inverse sample temperature, with corresponding linear fits (dashed lines). The extracted values of Eads and ν are reported in the panels.
Current usage metrics show cumulative count of Article Views (full-text article views including HTML views, PDF and ePub downloads, according to the available data) and Abstracts Views on Vision4Press platform.
Data correspond to usage on the plateform after 2015. The current usage metrics is available 48-96 hours after online publication and is updated daily on week days.
Initial download of the metrics may take a while.