Fig. 1
Download original image
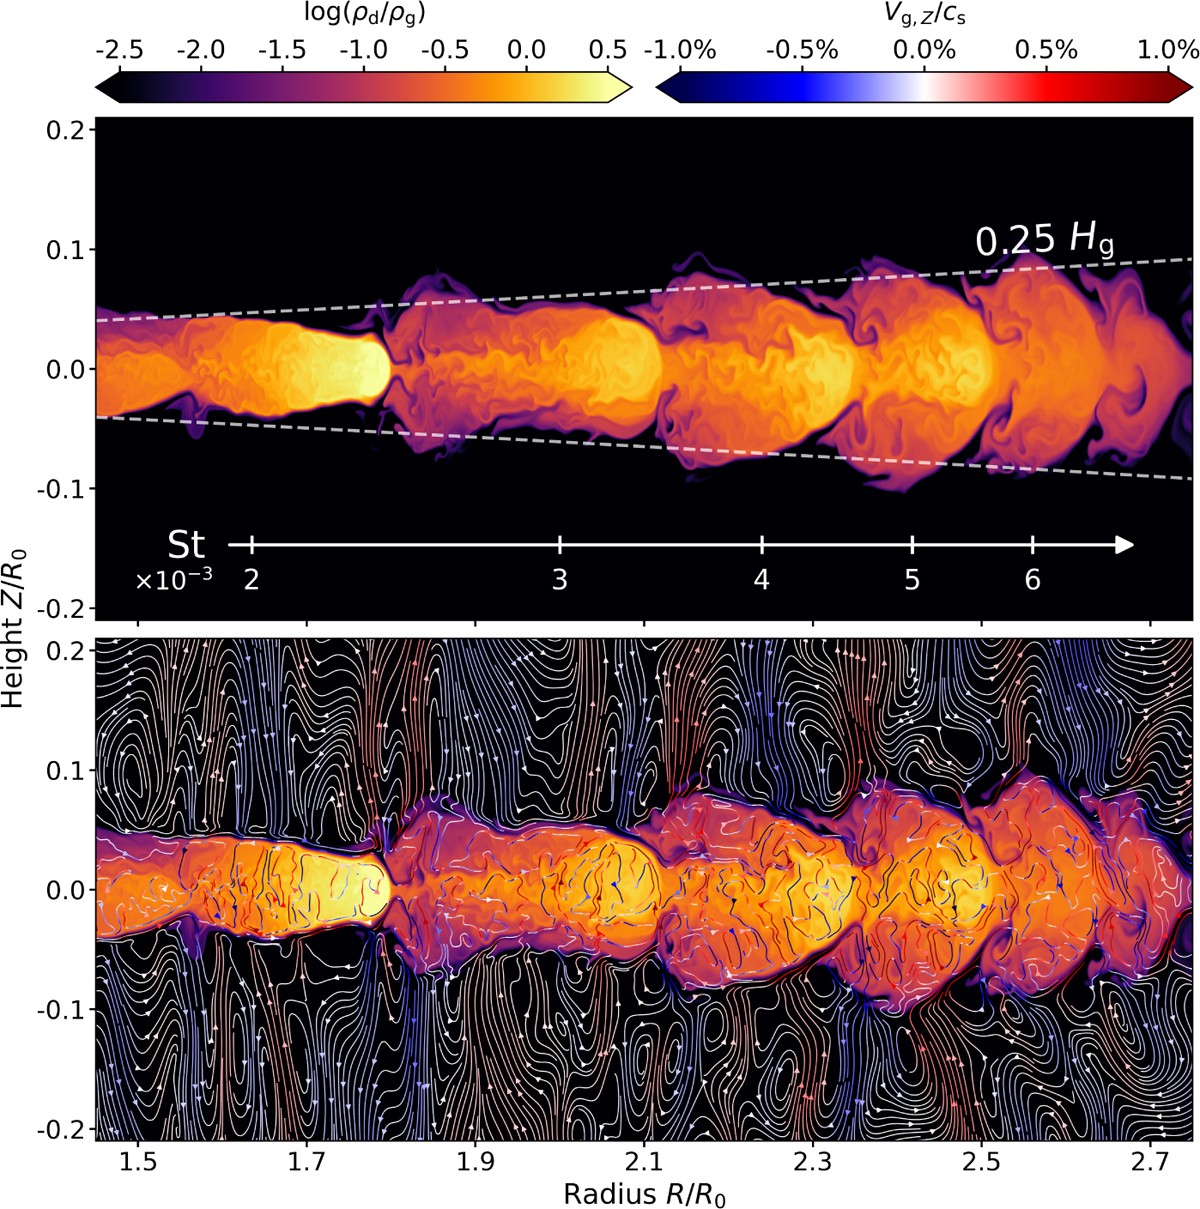
Dust-to-gas density ratio at t = 400 T0 from the model with α = 10−4 and St0 = 10−3. Dashed curves in the upper panel denote contours for 25% of the gas scale height, and the arrow below denotes the Stokes number of dust grains in the midplane. Gas streamlines are overplotted in the lower panel, with the line color denoting the vertical gas velocity.
Current usage metrics show cumulative count of Article Views (full-text article views including HTML views, PDF and ePub downloads, according to the available data) and Abstracts Views on Vision4Press platform.
Data correspond to usage on the plateform after 2015. The current usage metrics is available 48-96 hours after online publication and is updated daily on week days.
Initial download of the metrics may take a while.