Fig. A.1
Download original image
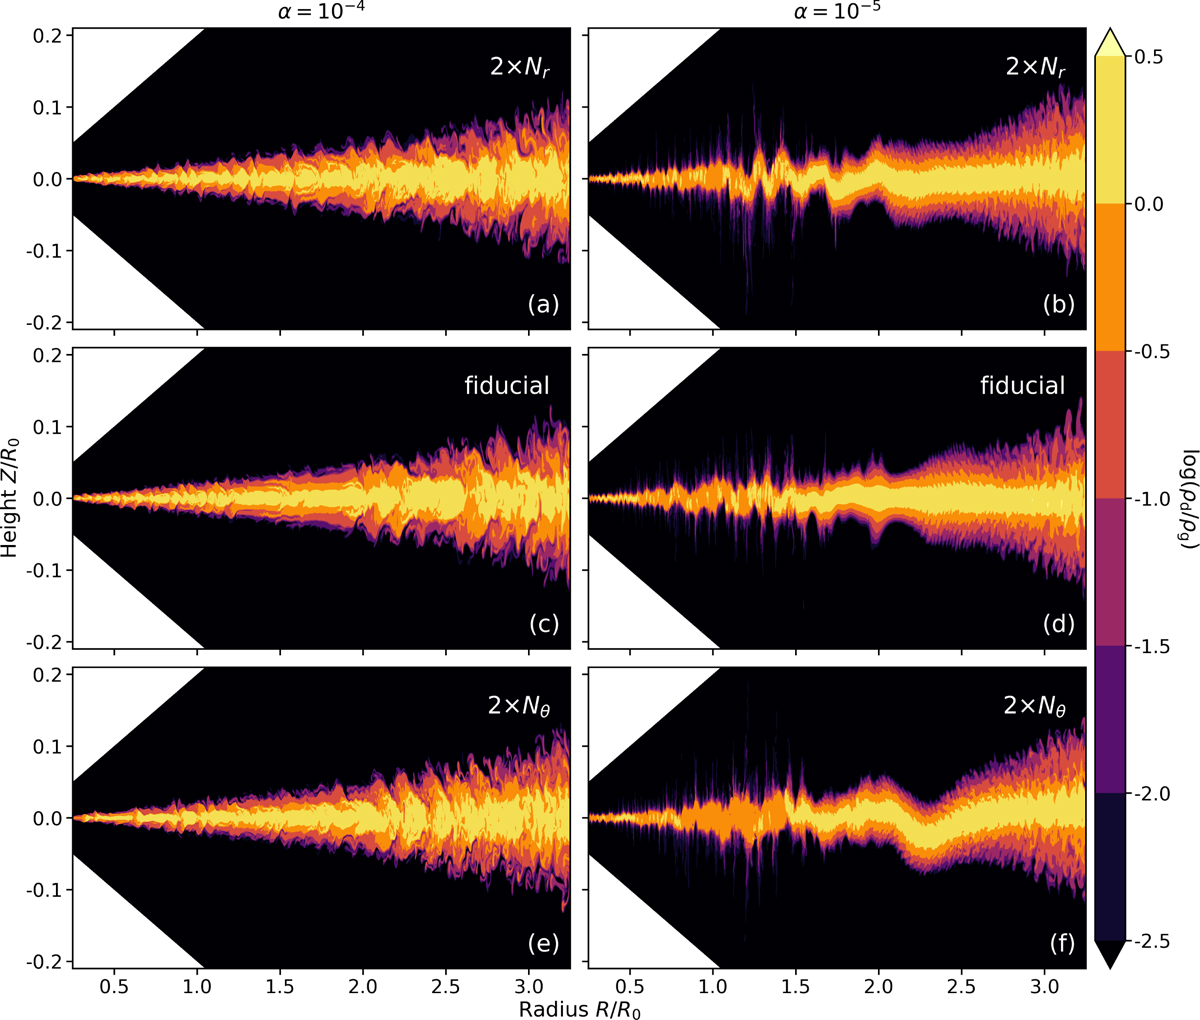
Dust-to-gas density ratio at t = 100 T0 from models with different numerical resolutions. The left and right columns correspond to models with α = 10−4 and 10−5, respectively. Middle row: Models with the fiducial resolution (i.e., ~200 cells per Hg in both directions). Top and bottom rows: Models with two times higher resolution than fiducial in the r direction (top) and θ direction (bottom).
Current usage metrics show cumulative count of Article Views (full-text article views including HTML views, PDF and ePub downloads, according to the available data) and Abstracts Views on Vision4Press platform.
Data correspond to usage on the plateform after 2015. The current usage metrics is available 48-96 hours after online publication and is updated daily on week days.
Initial download of the metrics may take a while.