Fig. B.1
Download original image
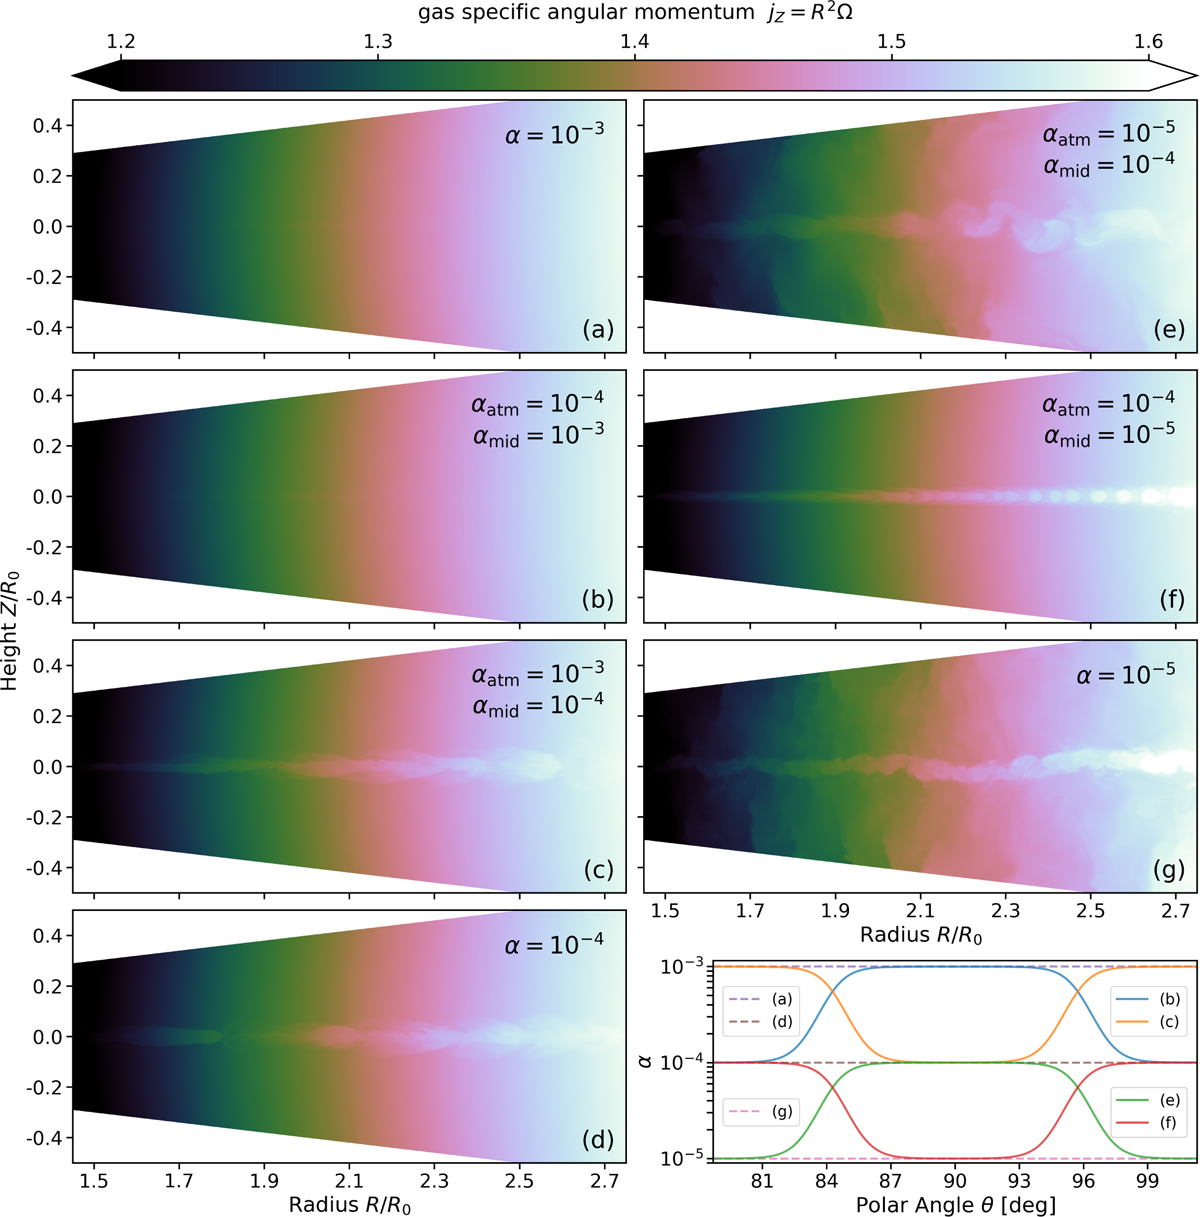
Specific angular momentum of gas at t = 400 T0 from models with different vertical prescriptions of the α parameter. Panels a, d, and g: Models in which α = 10−3, 10−4, and 10−5, respectively. Panel b: Model in which α decreases from 10−3 in the midplane to 10−4 in the atmosphere. Panel c: Model in which α increases from 10−4 in the midplane to 10−3 in the atmosphere. Panel e: Model in which α decreases from 10−4 in the midplane to 10−5 in the atmosphere. Panel f : Model in which α increases from 10−5 in the midplane to 10−4 in the atmosphere. Last panel: Corresponding vertical profiles of α.
Current usage metrics show cumulative count of Article Views (full-text article views including HTML views, PDF and ePub downloads, according to the available data) and Abstracts Views on Vision4Press platform.
Data correspond to usage on the plateform after 2015. The current usage metrics is available 48-96 hours after online publication and is updated daily on week days.
Initial download of the metrics may take a while.