Open Access
Fig. B.2
Download original image
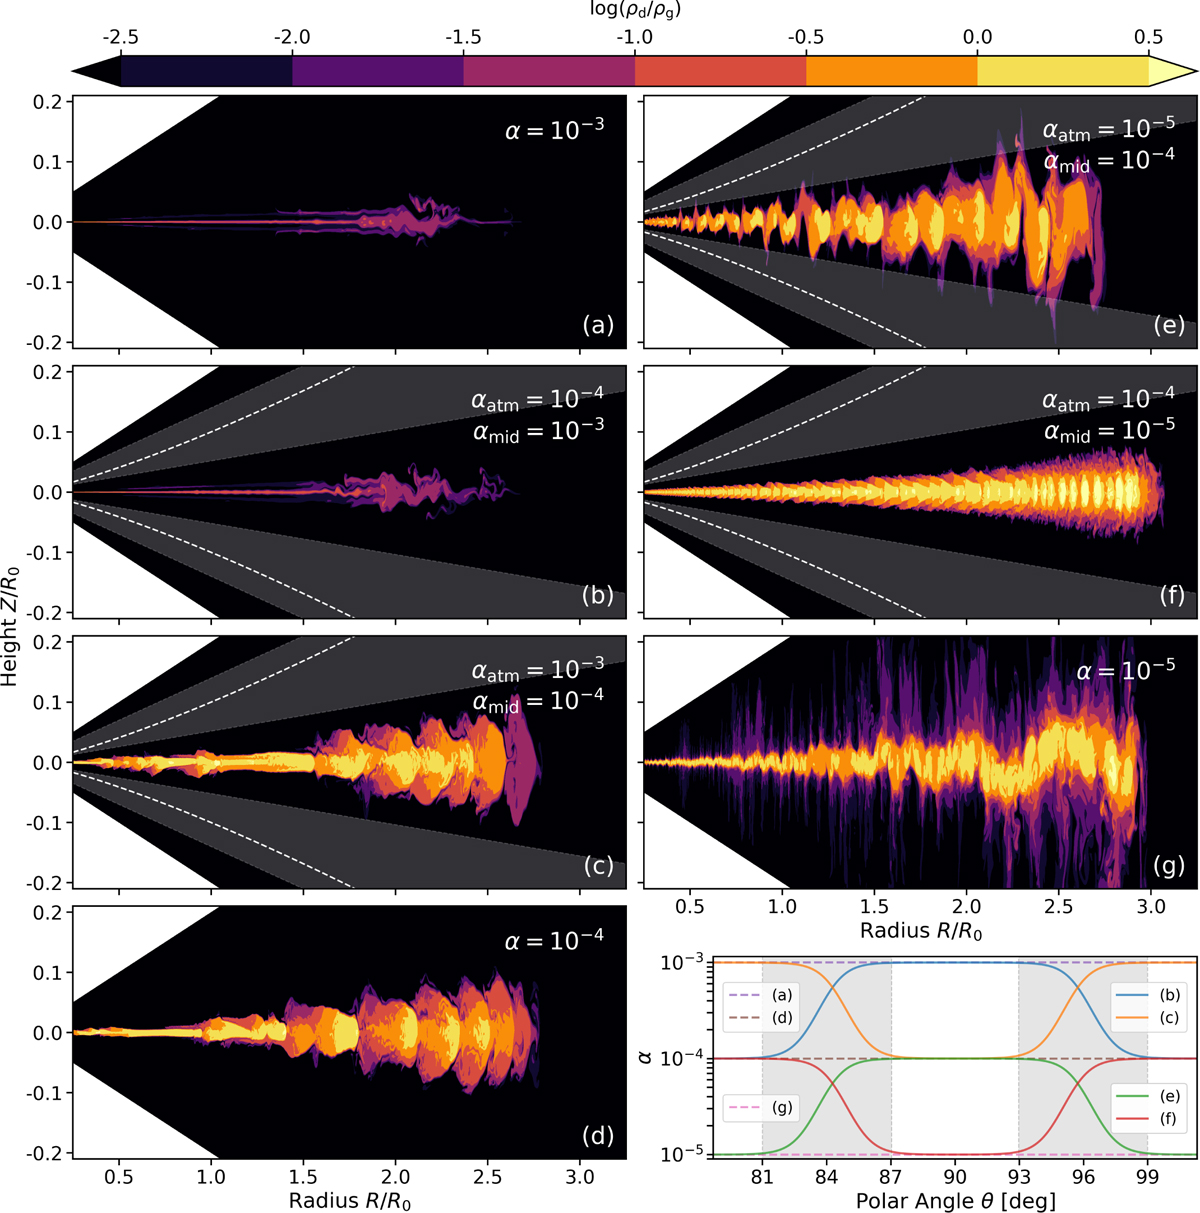
Similar to Fig. B.1 but for the dust-to-gas density ratio. Dashed curves in panels b, c, e, and f denote contours for one gas scale height. The shaded regions indicate where the transition of α occurs and are bounded by aspect ratios evaluated at the inner and outer radial boundaries.
Current usage metrics show cumulative count of Article Views (full-text article views including HTML views, PDF and ePub downloads, according to the available data) and Abstracts Views on Vision4Press platform.
Data correspond to usage on the plateform after 2015. The current usage metrics is available 48-96 hours after online publication and is updated daily on week days.
Initial download of the metrics may take a while.