Fig. 2
Download original image
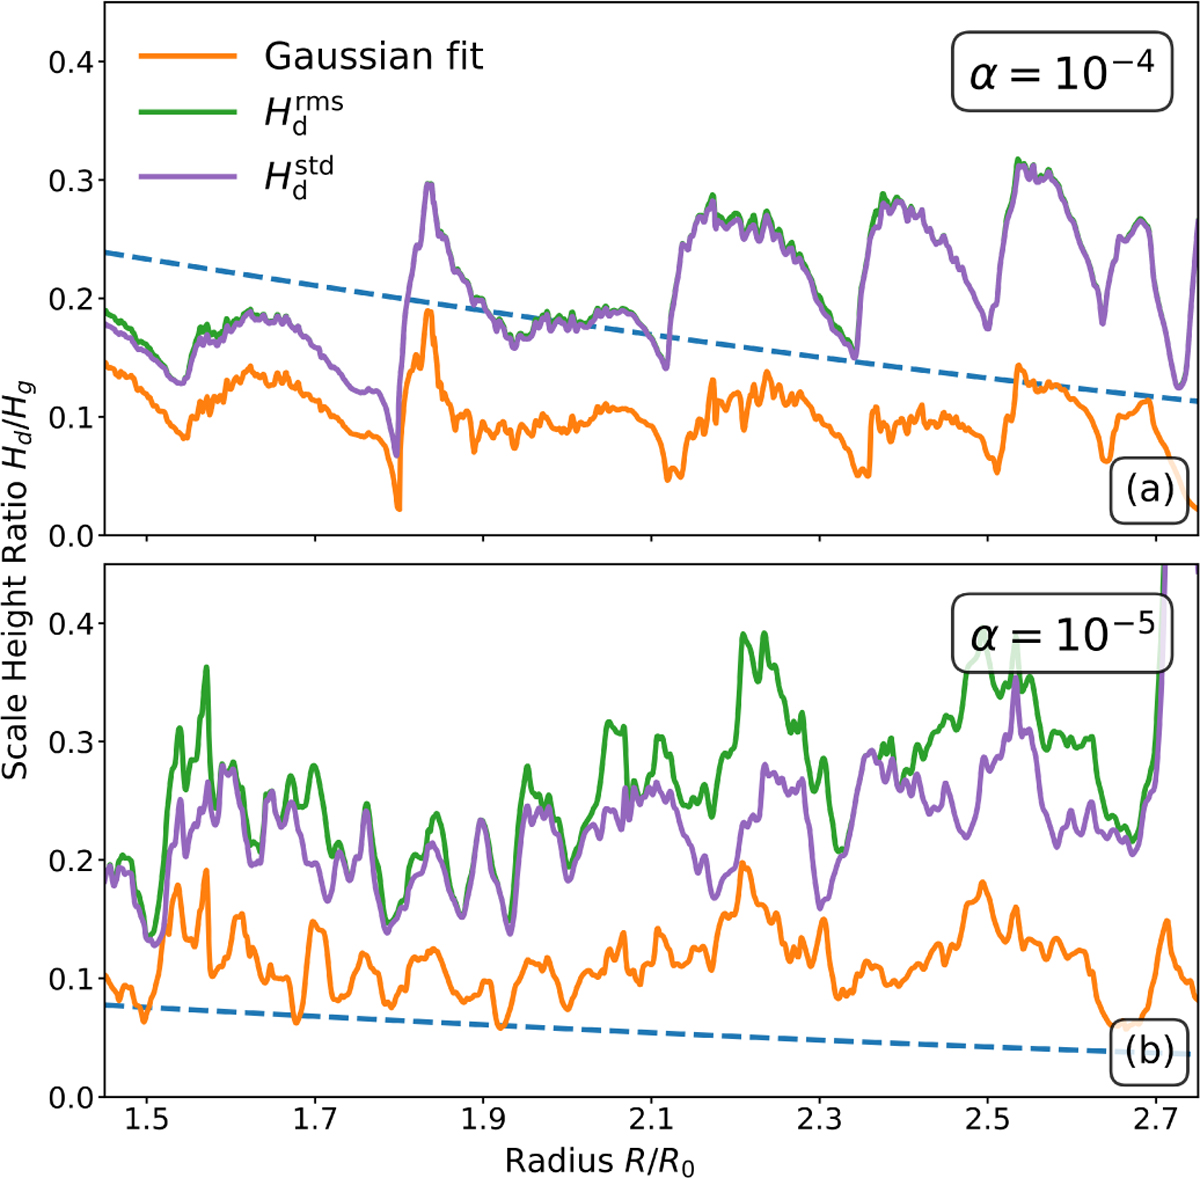
Radial profiles of the dust-to-gas scale height ratio at t = 400 T0 from models with α = 10−4 (panel a) and α = 10−5 (panel b), both with St0 = 10−3. The dust scale heights are measured using the root mean square (![]() , Eq. (27)), the standard deviation (
, Eq. (27)), the standard deviation (![]() , Eq. (28)), or by fitting a Gaussian profile. The dashed curve indicates a reference-only expected ratio assuming explicit dust diffusion, as given by Eq. (29). The radial extent is the same as in Figs. 1 and 4.
, Eq. (28)), or by fitting a Gaussian profile. The dashed curve indicates a reference-only expected ratio assuming explicit dust diffusion, as given by Eq. (29). The radial extent is the same as in Figs. 1 and 4.
Current usage metrics show cumulative count of Article Views (full-text article views including HTML views, PDF and ePub downloads, according to the available data) and Abstracts Views on Vision4Press platform.
Data correspond to usage on the plateform after 2015. The current usage metrics is available 48-96 hours after online publication and is updated daily on week days.
Initial download of the metrics may take a while.