Online Material
Table 1: Summary of previous high angular resolution studies of 6.7 GHz methanol masers.
Table 2: Sample of methanol masers observed with the EVN. The names are the Galactic coordinates of the brightest spot of each target obtained in post-processing EVN data. The dates of each observing run are listed in Table 4. The phase-calibrator names and angular separations from the targets are given.
Table 3: Targets not detected with the MERLIN single baseline. The source names, coordinates, and peak flux velocities are taken from Szymczak et al. (2002).
Table 6:
Maser clusters towards 31 sources. If a spectrum of a maser
cluster does not show a Gaussian profile we enter the sign - in the
Cols. of FWHM and
![]() .
.
![\begin{figure}\par\includegraphics[scale=0.9]{12250f10.eps}
\end{figure}](img68.png) |
Figure 3:
The 8.4 GHz continuum emission detected using VLA on 2007 August 18.
The names of radio continuum sources (RC) are the Galactic coordinates of
peak fluxes. The peak and integrated fluxes as well as the levels of rms
(1
|
| Open with DEXTER | |
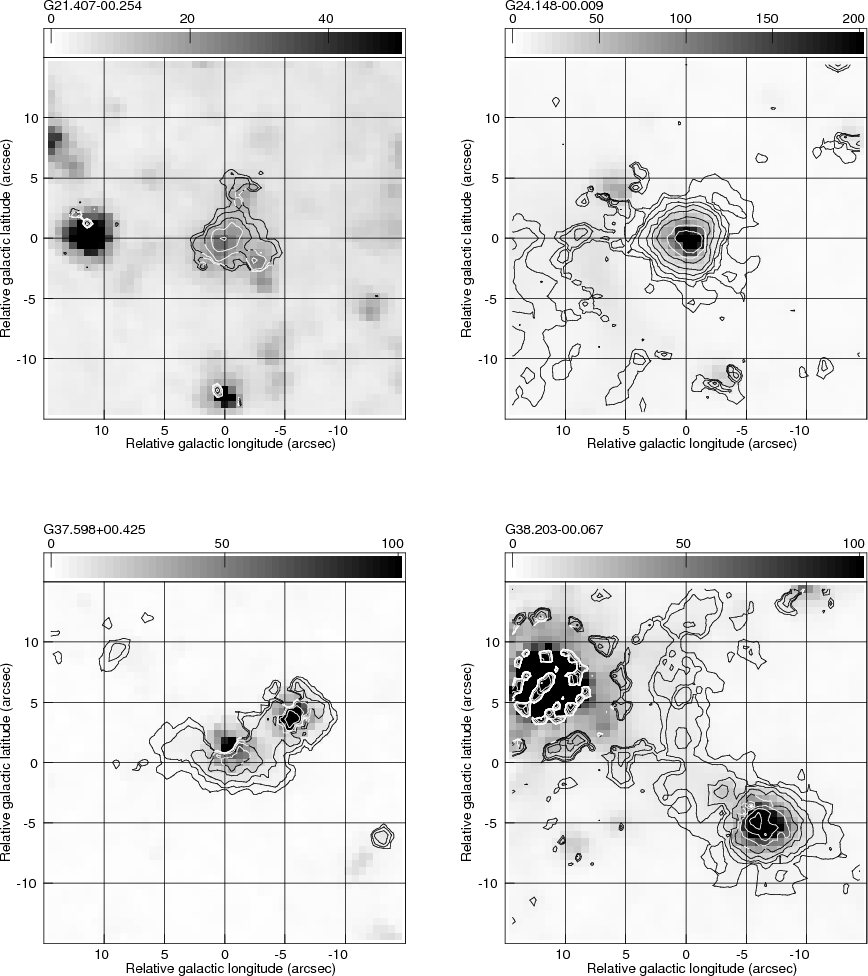 |
Figure 6:
Spitzer IRAC 4.5 |
| Open with DEXTER | |