Online Material
Appendix A: Photoproduct growth curves during UV-irradiation
A.1 Pure CH3OH ice at different temperatures
Figures A.1 and A.2 show the increasing abundances of photoproducts during irradiation of pure CH3OH ices at 30 and 50 K (experiments 2 and 3). The abundances are fitted as a function of UV fluence as described fully in Sect. 3.6 for 20 K and 70 K ices. The abundances follow the temperature trends suggested by the 20 K and 70 K ices (experiments 1 and 4), except possibly for CH3CH2OH, which seems to be enhanced at 30 K compared to the other ices. This enhancement is barely significant however. The fit coefficients and uncertainties for all irradiated ![]() 20 L, pure CH3OH ices are reported in Table C.1.
20 L, pure CH3OH ices are reported in Table C.1.
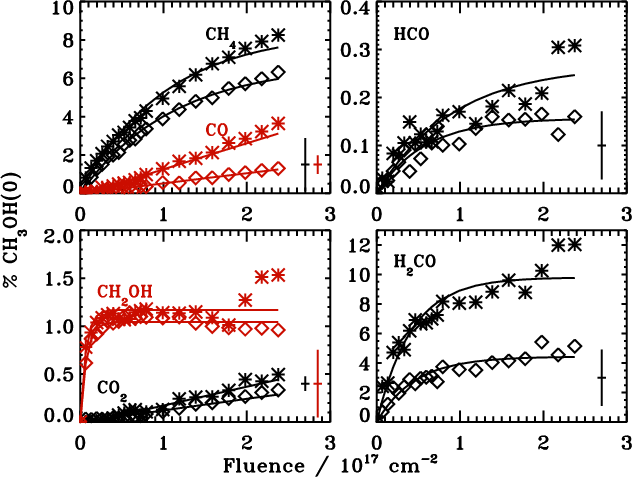 |
Figure A.1: The evolution of small CH3OH photo-products with respect to UV fluence in % of the initial CH3OH ice abundance, CH3OH(0), in each experiment at 30 K (stars) and 50 K (diamonds). The relative uncertainty for each abundance is indicated in the bottom right corner. The lines are exponential fits to the abundance growths. |
| Open with DEXTER | |
 |
Figure A.2: The evolution of complex CH3OH photo-products with respect to UV fluence in % of the initial CH3OH ice abundance. Otherwise as Fig. A.1. |
| Open with DEXTER | |
A.2 High fluence experiments
Figures A.3 and A.4 show the increasing abundances of photoproducts during irradiation at 20 K and 50 K with a high flux
(experiments 5 and 6), together with the fitted growth curves. The first
![]() photons cm-2 are consistent with the low flux experiments within the experimental uncertainties. For molecules such as CH3CHO that forms slowly, these experiments provide better constraints on the production rates than the low flux experiments. In contrast, molecules and fragments with high production rates are better constrained by the lower flux experiments, since they have a abundance determinations at a higher fluence resolution. The production rates of molecules that are destroyed/photodesorbed faster than they are produced at high fluences cannot be fit in these experiments. The fit coefficients of these experiments are reported in Table C.1.
photons cm-2 are consistent with the low flux experiments within the experimental uncertainties. For molecules such as CH3CHO that forms slowly, these experiments provide better constraints on the production rates than the low flux experiments. In contrast, molecules and fragments with high production rates are better constrained by the lower flux experiments, since they have a abundance determinations at a higher fluence resolution. The production rates of molecules that are destroyed/photodesorbed faster than they are produced at high fluences cannot be fit in these experiments. The fit coefficients of these experiments are reported in Table C.1.
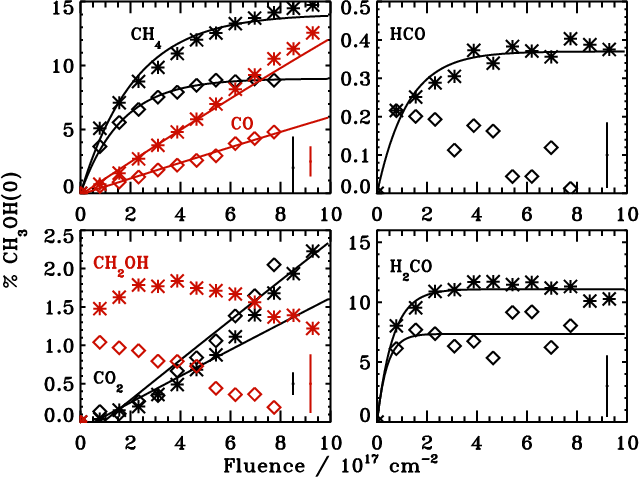 |
Figure A.3: The evolution of small CH3OH photo-products with respect to UV fluence in % of the initial CH3OH ice abundance (CH3OH(0)) in the two high flux/fluence experiments at 20 K (stars) and 50 K (diamonds). The relative uncertainty for each abundance is indicated in the bottom right corner. The lines are exponential fits to the abundance growths. |
| Open with DEXTER | |
 |
Figure A.4: The evolution of complex CH3OH photo-products with respect to UV fluence in % of the initial CH3OH ice abundance. Otherwise as Fig. A.3. |
| Open with DEXTER | |
A.3 CH4 and CO mixtures
 |
Figure A.5: The evolution of small photo-products with respect to UV fluence in % of the initial CH3OH ice abundance in CH3OH:CO 1:1 ice mixture experiments at 30 K (stars) and 50 K (diamonds). |
| Open with DEXTER | |
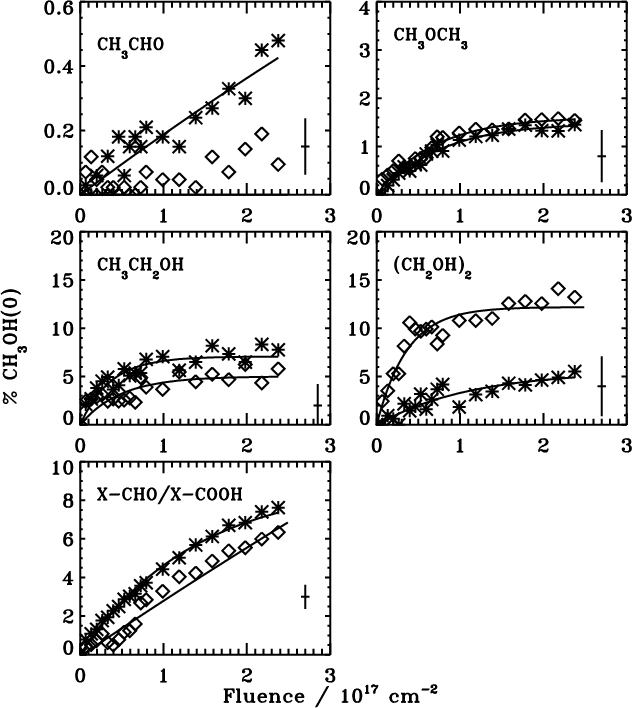 |
Figure A.6: The evolution of complex photo-products with respect to UV fluence in % of the initial CH3OH ice abundance in CH3OH:CO 1:1 ice mixture experiments at 30 K (stars) and 50 K (diamonds). |
| Open with DEXTER | |
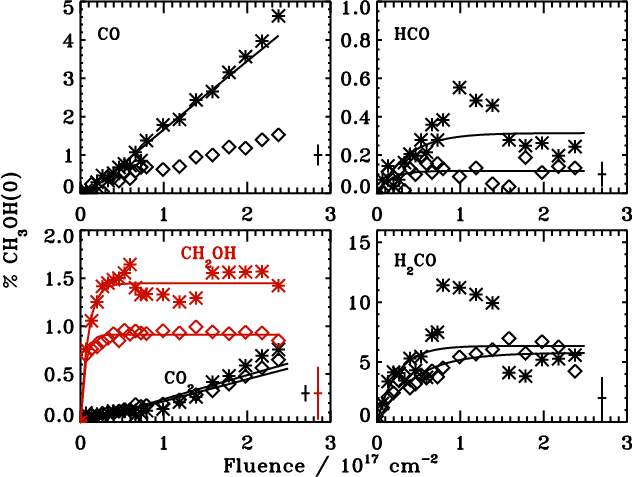 |
Figure A.7: The evolution of small photo-products with respect to UV fluence in % of the initial CH3OH ice abundance in CH3OH:CH4 1:2 ice mixture experiments at 30 K (stars) and 50 K (diamonds). |
| Open with DEXTER | |
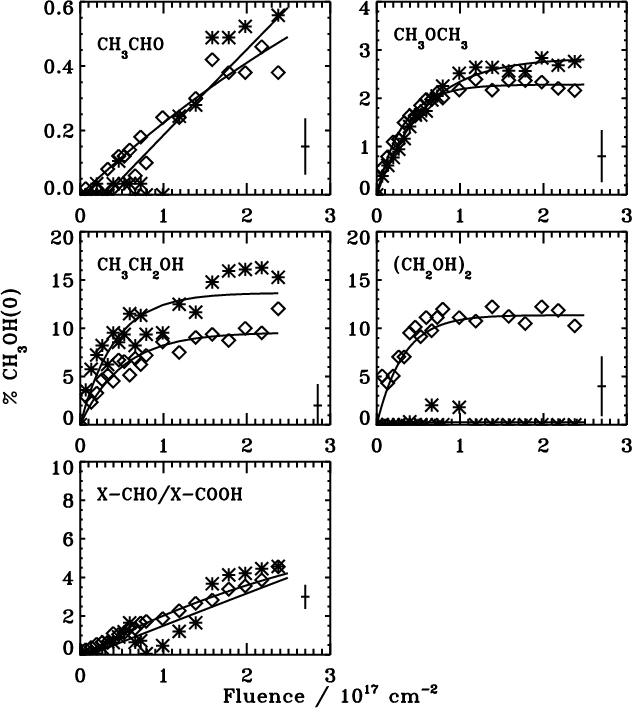 |
Figure A.8: The evolution of small photo-products with respect to UV fluence in % of the initial CH3OH ice abundance in CH3OH:CH4 1:2 ice mixture experiments at 30 K (stars) and 50 K (diamonds). |
| Open with DEXTER | |
Figures A.5-A.8 show the increasing abundances of photoproducts during irradiation of CH3OH:CH4 1:2 and CH3OH:CO 1:1 mixtures at 30 K and 50 K together with fitted growth curves. The temperature trends are similar to what is seen for pure CH3OH ice. As suggested from the spectra in Sect. 3.3.5, all HCO containing species are increased in abundance in the CO mixtures, with the exception of CH3CHO, which is mainly enhanced in the CH4 ice mixture. The other two CH3 containing species, CH3CH2OH and CH3OCH3, are also enhanced in the CH4 mixture compared both to pure CH3OH and the CO ice mixture - in the CO mixtures the abundance points represent upper limits. In contrast the (CH2OH)2 production is suppressed in both ice mixtures at 30 K. The fit coefficients of these experiments and CO:CH3OH 1:1 mixture irradiated at 20 K are reported in Table C.2.
Appendix B: Formation and destruction curves during warm-up
B.1 Pure CH3OH at different irradiation temperatures
Figures B.1 and B.2 show the evolution of photoproduct abundances during warm-up following irradiation of pure CH3OH ices at 30 and 50 K (experiments 2 and 3). The abundances follow the warm-up trends suggested by the 20 and 70 K ices (experiments 1 and 4). The CH3CH2OH desorption starts at a lower temperature than in pure CH3CH2OH, suggesting that similarly to the 20 K experiment, a substantial part of the CH3CH2OH desorbs together with CH3OH.
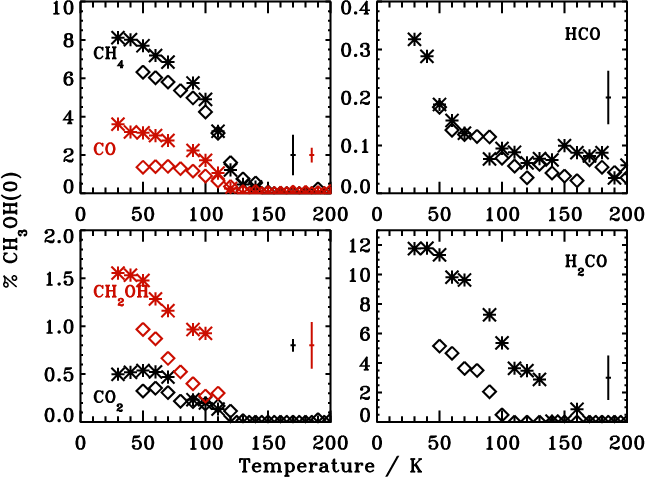 |
Figure B.1: The evolution of small CH3OH photo-products with respect to UV fluence in % of the initial CH3OH ice abundance in pure CH3OH irradiation experiments at 30 K (stars) and 50 K (diamonds). The average uncertainties are indicated by the error bar to the right in each panel. |
| Open with DEXTER | |
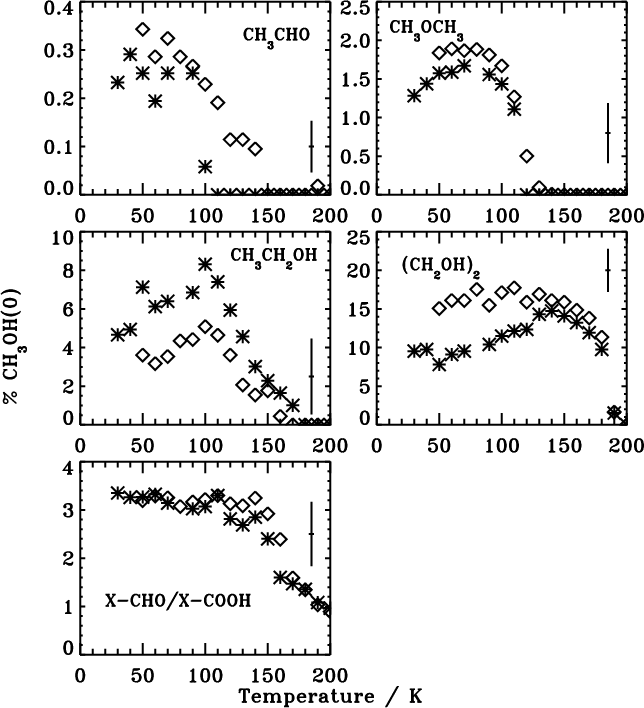 |
Figure B.2: The evolution of complex CH3OH photo-products with respect to UV fluence in % of the initial CH3OH ice abundance in pure CH3OH irradiation experiments at 30 K (stars) and 50 K (diamonds). The average uncertainties are indicated by the error bar to the right in each panel. |
| Open with DEXTER | |
B.2 CH4 and CO mixtures
The warm-up trends are similar in the experiments where CH4 and CO are mixed with the CH3OH ice, at a 1(2):1 ratio, compared to the pure CH3OH experiments (Figs. B.3-B.6). The CH3-containing molecules CH3CHO and CH3CH2OH show a remarkable growth between 30 and 50 K, which is only hinted at in the pure CH3OH experiments, suggesting a significant build-up of CH3 radicals in these ice mixture experiments. In contrast the (CH2OH)2 formation rate is low during warm-up of the 30 K experiments.
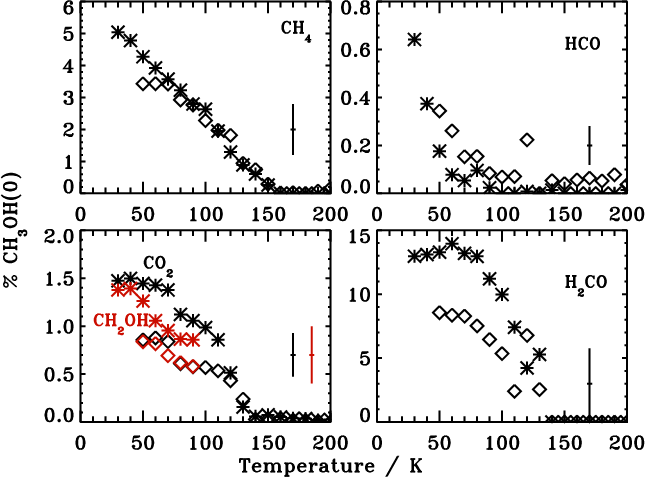 |
Figure B.3: The evolution of small photo-products, in % of the initial CH3OH ice abundance, with respect to temperature following irradiation of CH3OH:CO 1:1 ice mixtures at 30 (stars) and 50 K (diamonds). The average uncertainties are indicated by the error bar to the right in each panel. |
| Open with DEXTER | |
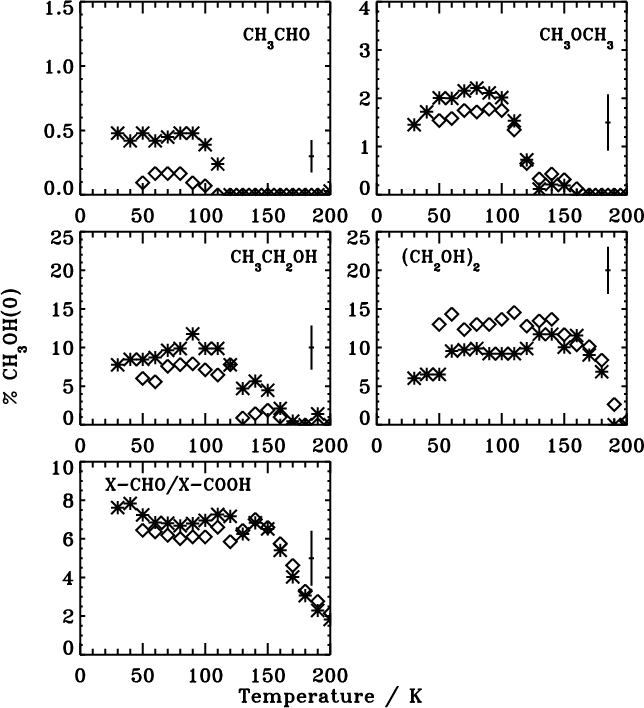 |
Figure B.4: The evolution of small photo-products, in % of the initial CH3OH ice abundance, with respect to temperature following irradiation of CH3OH:CH4 1:2 ice mixtures at 30 (stars) and 50 K (diamonds). The average uncertainties are indicated by the error bar to the right in each panel. |
| Open with DEXTER | |
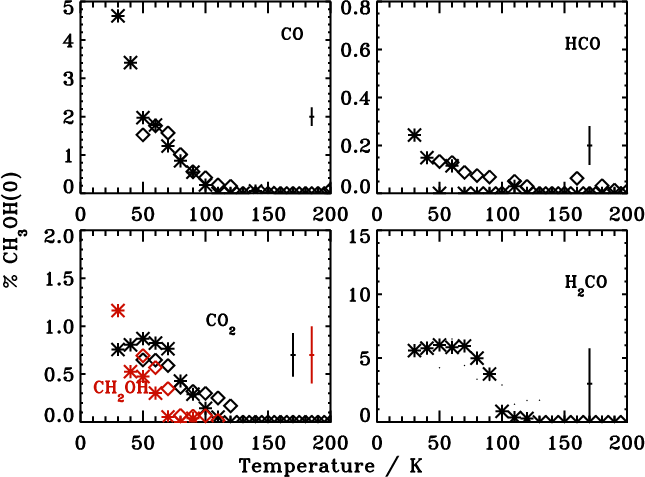 |
Figure B.5: The evolution of small photo-products, in % of the initial CH3OH ice abundance, with respect to temperature following irradiation of CH3OH:CO 1:1 ice mixtures at 30 (stars) and 50 K (diamonds). The average uncertainties are indicated by the error bar to the right in each panel. |
| Open with DEXTER | |
 |
Figure B.6: The evolution of small photo-products, in % of the initial CH3OH ice abundance, with respect to temperature following irradiation of CH3OH:CH4 1:2 ice mixtures at 30 (stars) and 50 K (diamonds). The average uncertainties are indicated by the error bar to the right in each panel. |
| Open with DEXTER | |
Appendix C: Formation rate parameters
The production of simple and complex molecules during UV irradiation is parameterized with
![]() for 13 of the experiments, where A1 correspond to the equilibrium abundance in % of the initial CH3OH abundance, A2 is the fluence offset in 1017 cm-2 before production starts and A3 describes the formation and destruction rates in fluence space in 10-17 cm2
(Tables C.1 and C.2). The experiments include all pure 6-20 ML CH3OH experiments irradiated with the normal flux setting, two 20 ML pure CH3OH experiments irradiated with the higher flux setting, and all ice mixture experiments except for the CH3OH:CO 1:10 experiment. The 1:10 experiment is excluded since the formation of any molecules is too low to detect during irradiation itself. The fitted experiments are numbered as in Table 1.
for 13 of the experiments, where A1 correspond to the equilibrium abundance in % of the initial CH3OH abundance, A2 is the fluence offset in 1017 cm-2 before production starts and A3 describes the formation and destruction rates in fluence space in 10-17 cm2
(Tables C.1 and C.2). The experiments include all pure 6-20 ML CH3OH experiments irradiated with the normal flux setting, two 20 ML pure CH3OH experiments irradiated with the higher flux setting, and all ice mixture experiments except for the CH3OH:CO 1:10 experiment. The 1:10 experiment is excluded since the formation of any molecules is too low to detect during irradiation itself. The fitted experiments are numbered as in Table 1.
It is important to note that the fitted formation ``cross sections'' cannot be used directly in astrophysical models, but rather should be used to compare models of the experiments with the experimental results. The quoted uncertainties in the tables are the fit error and do not include systematic uncertainties, in particular the conversion error between integrated band strength and abundances of ![]() 20% and the fluence uncertainty of
20% and the fluence uncertainty of ![]() 30%.
30%.
Table C.1: Photoproduct crosssection coefficents for pure CH3OH experiments 1-6 as listed in Table 1.
Table C.2:
Photoproduct crosssection coefficents for ice mixture experiments 7-11, 13, 14 as listed in Table 1.