 |
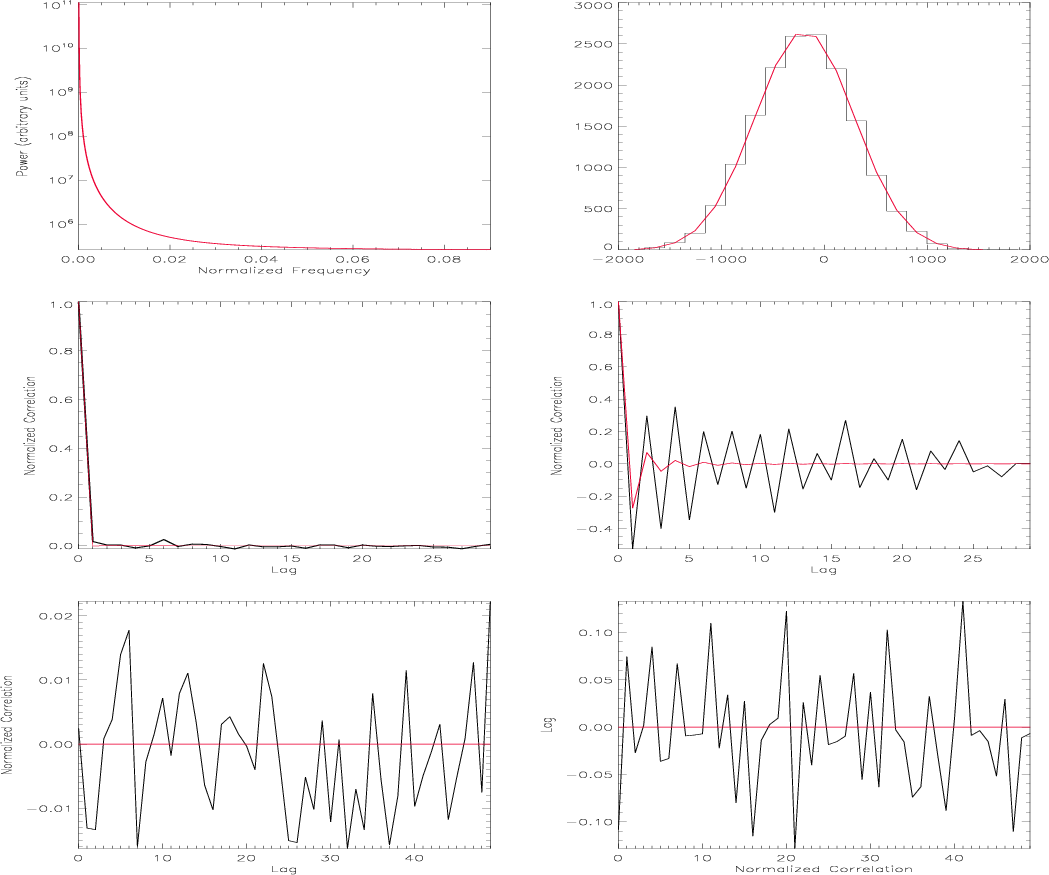
Figure 1: From left to right and from top to bottom, input power spectrum of simulated 1/f-type noise, histogram of the simulated noise wavelet coefficients and their expected values at scale j=1, correlation of the wavelet coefficients and their expected values for scale j=1 and j=10 and cross correlation of the wavelet coefficients at j=1 and j=10 with scales j=2 and j=11 respectively. |
| Open with DEXTER | |
In the text
| |
Figure 2: Left panel: simulated 1/f-type noise using a wavelet algorithm. Right panel: power spectrum of the wavelet simulated 1/f-type noise compared to the input power spectrum in red. |
| Open with DEXTER | |
In the text
| |
Figure 3: From left to right, locally stationary Gaussian noise obtained from two white noises of variances 1 and 25, and its wavelet transform with wavelet coefficients ordered from left to right for decreasing scale. |
| Open with DEXTER | |
In the text
![\begin{figure}
\par\includegraphics[height=9cm,width=7.8cm,clip]{Figures/4468f11.ps} \end{figure}](/articles/aa/full/2006/45/aa4468-05/img162.gif) |
Figure 4:
Top: reconstructed time modulation function |
| Open with DEXTER | |
In the text
![\begin{figure}
\par\includegraphics[height=4.4cm,width=7.2cm,clip]{Figures/4468f12.ps}\end{figure}](/articles/aa/full/2006/45/aa4468-05/img197.gif) |
Figure 5: Baseline reconstruction on simulated Archeops data using a wavelet based destriping algorithm. In black we trace the simulated Archeops TOD. We overplot the reconstructed baseline in blue, green and red for the first, second, and third steps of the algorithm, respectively. |
| Open with DEXTER | |
In the text
![\begin{figure}
\par\includegraphics[height=3.85cm,width=7.3cm,clip]{Figures/4468...
...\includegraphics[height=3.85cm,width=7.3cm,clip]{Figures/4468f14.ps}\end{figure}](/articles/aa/full/2006/45/aa4468-05/img199.gif) |
Figure 6: Top panel: destriped map of the simulated Archeops data at 545 GHz using the wavelet destriping algorithm. Bottom panel: residual stripes on the destriped map above. |
| Open with DEXTER | |
In the text
![\begin{figure}
\par\includegraphics[height=8.7cm,width=7.7cm,clip]{Figures/4468f15.ps}\end{figure}](/articles/aa/full/2006/45/aa4468-05/img201.gif) |
Figure 7: Top: time-frequency analysis of the TOD of the 217K04 Archeops bolometer using the DWPT. Bottom: time-frequency analysis of the expected Galactic emission in the TOD of the 217K04 Archeops bolometer using the DWPT. See text for details. |
| Open with DEXTER | |
In the text
![\begin{figure}
\par\includegraphics[height=8.7cm,width=7.7cm,clip]{Figures/4468f16.ps}\end{figure}](/articles/aa/full/2006/45/aa4468-05/img202.gif) |
Figure 8: Top: time-frequency analysis of the TOD of the 217T04 Archeops bolometer using the DWPT. Bottom: time-frequency analysis of the expected Galactic emission in the TOD of the 217T04 Archeops bolometer using the DWPT. See text for details. |
| Open with DEXTER | |
In the text
![\begin{figure}
\par\includegraphics[height=9cm,width=7.8cm,clip]{Figures/4468f17.ps}\end{figure}](/articles/aa/full/2006/45/aa4468-05/img203.gif) |
Figure 9: Top: average power spectrum of the TOD of the 217K04 Archeops bolometer as a function of frequency computed from its DWPT. Bottom: time evolution of the power spectrum of the TOD of the 217K04 Archeops bolometer computed from its DWPT. |
| Open with DEXTER | |
In the text
![\begin{figure}
\par\includegraphics[height=8.2cm,width=4.3cm,angle=90,clip]{Figu...
...graphics[height=8.2cm,width=4.3cm,angle=90,clip]{Figures/4468f19.ps}\end{figure}](/articles/aa/full/2006/45/aa4468-05/img204.gif) |
Figure 10: Top: wavelet destriped map of the Archeops 545 GHz after one iteration of the algorithm described in Sect. 5. Bottom: wavelet destriped map of the Archeops 545 GHz after two iteration of the algorithm. |
| Open with DEXTER | |
In the text
| |
Figure 11: Performance of the wavelet filtering in the 353 GHz Archeops data. In orange we trace the reconstructed data baseline using a fit to a base of Gabor atoms. In blue we represent the reconstructed baseline using the wavelet detrending algorithm. |
| Open with DEXTER | |
In the text
![\begin{figure}
\par\includegraphics[height=8.25cm,width=4.3cm,angle=90,clip]{Fig...
...raphics[height=8.25cm,width=4.3cm,angle=90,clip]{Figures/4468f22.ps}\end{figure}](/articles/aa/full/2006/45/aa4468-05/img207.gif) |
Figure 12: Top: fourier-filtered map of the Archeops 353 GHz data. Bottom: wavelet-filtered map of the of the Archeops 353 GHz data. See text for details. |
| Open with DEXTER | |
In the text