| Issue |
A&A
Volume 501, Number 2, July II 2009
|
|
|---|---|---|
| Page(s) | 429 - 435 | |
| Section | Extragalactic astronomy | |
| DOI | https://doi.org/10.1051/0004-6361/200811331 | |
| Published online | 13 May 2009 | |
On the nature of IC 3328, an early-type dwarf galaxy with weak
spiral structure![[*]](/icons/foot_motif.png)
T. Lisker - B. Fuchs
Astronomisches Rechen-Institut, Zentrum für Astronomie der Universität Heidelberg, Mönchhofstraße 12-14, 69120 Heidelberg, Germany
Received 11 November 2008 / Accepted 13 March 2009
Abstract
Various early-type dwarf galaxies with disk features have been identified in
the Virgo cluster, including
objects that display weak grand-design spiral arms despite being devoid of
gas. Are these still related to the classical dEs, or
are they a
continuation of ordinary spiral galaxies? Kinematical information of acceptable quality is
available for one of these galaxies, IC 3328. We investigated
its dynamical configuration, taking the
effect of asymmetric drift into account, and using the Toomre parameter, as well as
density wave considerations. The derived mass-to-light ratios and
rotational velocities indicate a significant dynamically
hot component in addition to the disk. However, any unambiguous conclusions
will need to await further data for this and other
early-type dwarfs with spiral structure.
Key words: galaxies: dwarf - galaxies: elliptical and lenticular, cD - galaxies: fundamental parameters - galaxies: kinematics and dynamics - galaxies: spiral - galaxies: structure
1 Introduction
As the most numerous type of galaxy in clusters and the possible descendants of the building blocks in hierarchical structure formation, early-type dwarf (dE) galaxies play a key role toward understanding galaxy cluster evolution. Initially believed to be spheroidal objects having old stellar populations and preferring the high-density regions of clusters, today's picture of dEs is far more diverse. In the Virgo cluster, several subclasses with significantly different characteristics exist (Lisker et al. 2007), and these are correlated with environmental density. Those dEs that populate less dense cluster regions partly have younger stellar populations (Lisker et al. 2006a,2008), flatter shapes (Lisker et al. 2007; Ferguson & Sandage 1989; Lisker et al. 2006b), and clustering properties not like giant ellipticals but similar to spiral galaxies (Lisker et al. 2007).
Among them is the ``dE(di)'' subclass, characterised by weak disk features - like spiral arms or bars - that could only be seen through unsharp masks or by subtracting a model of the smooth galaxy light (Lisker et al. 2006b). The first discovery of spiral structure in a dE was reported by Jerjen et al. (2000) for the galaxy IC 3328 (VCC 856), which is also the focus of the work presented here (Fig. 1). The dE(di)s are not a negligible species, but they make up one third of the brighter (MB<-16) Virgo cluster dEs, reaching a fraction of 50% at the bright end. For those showing spiral substructure, the arm opening angles are inconsistent with being the mere remainders of late-type progenitor galaxies (Lisker et al. 2006b; Jerjen et al. 2000), and the arms do not show up in colour maps that would indicate stellar population differences (Lisker et al. 2006b).
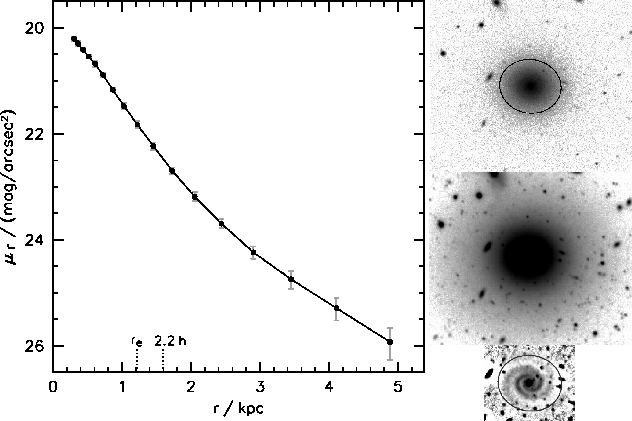 |
Figure 1:
Appearance and light profile of IC 3328. Surface
brightness in SDSS-r versus radius, adopting a distance modulus
m-M=31.0 mag (d=15.85 Mpc, van den Bergh 1996), corresponding to a scale of
77 pc/
|
| Open with DEXTER | |
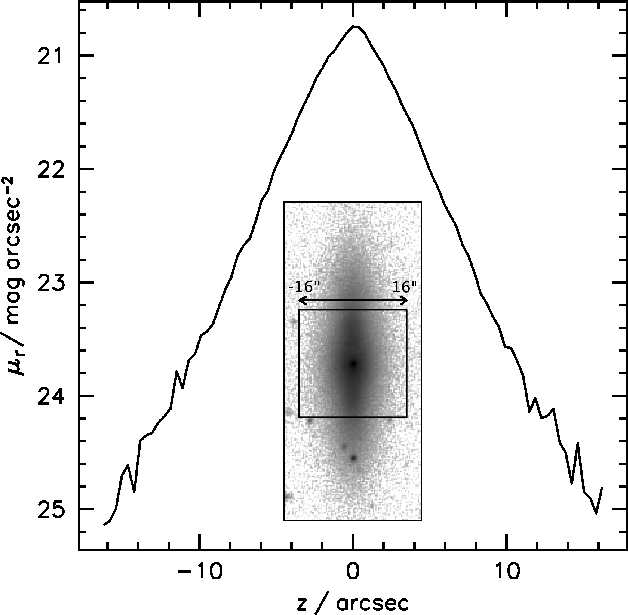 |
Figure 2:
Light profile in z-direction of IC 3435. SDSS r-band
image (inset) of IC 3435, and the intensity profile obtained by
collapsing the outlined box-shaped region along the galaxy's major
axis. The box has a side length corresponding to the major axis of
the half-light elliptical isophote, or equivalently, three times its
minor axis. Smearing due to seeing effects can occur in the innermost
|
| Open with DEXTER | |
An indication that the dE(di)s might have been formed out of infalling disk galaxies is that spiral arms and bar structures in dEs also arise in N-body simulations of galaxy harassment (Mastropietro et al. 2005), in which late-type galaxies accreted by the cluster experience a violent structural transformation (Moore et al. 1996; also see Kormendy et al. 2009). Alternatively, the dE(di)s - being compact, gas-poor disk galaxies - might simply constitute the low-luminosity counterpart to normal S0/Sa galaxies, with a few ``dwarf-like'' S0/Sa galaxies possibly bridging the gap to the more luminous systems (Lisker et al. 2006a).
Do the dE(di)s have a significant dynamically hot component, which would be expected for dEs with embedded disks, or are they consistent with being pure disk galaxies? A first assessment can be provided by examining an apparently edge-on dE(di), IC 3435 (VCC 1304, Fig. 2, Lisker et al. 2006b). Its axis ratio of 0.33 equals the estimate for the intrinsic axis ratio of the dE(di)s from Lisker et al. (2007). While it is, of course, not known whether this galaxy hosts similar spiral structure to IC 3328, it still appears worth examining whether a thin disk component is visible in the vertical light profile, i.e. perpendicular to the disk. However, from the SDSS r-band image, no such component is seen (Fig. 2), and the profile appears perfectly consistent with a single exponential decline.
In this context, it would be obvious to ask about the kinematical properties of the dE(di)s with spiral arms. Unfortunately, useful kinematical data is only available for one of these enigmatic objects, namely IC 3328, and only along its major axis (Simien & Prugniel 2002). Here we attempt to draw conclusions on the nature of IC 3328 from these data.
2 Data
2.1 Structural measurements
Total magnitude, half-light radius, and ellipticity of IC 3328 were
measured from
r-band images of the Sloan Digital Sky Survey
(Adelman-McCarthy et al. 2007), as outlined in Lisker et al. (2008). The
ellipticity of 0.87, measured at the half-light radius, is consistent with the
ellipticity that could be derived from the spiral structure only, as
illustrated in Fig. 1. This yields an inclination
![]() .
The radial surface brightness profile in r, shown in
Fig. 1, was measured from annuli of fixed elliptical
shape, using IRAF/ellipse
.
The radial surface brightness profile in r, shown in
Fig. 1, was measured from annuli of fixed elliptical
shape, using IRAF/ellipse![]() (Tody 1993). Out to the radial extent of the
rotation curve (Fig. 3) it would be compatible with an
exponential profile, i.e. a straight line. Nevertheless, a change in
the profile slope is seen at larger radii. This is included in the
discussion (Sect. 4).
(Tody 1993). Out to the radial extent of the
rotation curve (Fig. 3) it would be compatible with an
exponential profile, i.e. a straight line. Nevertheless, a change in
the profile slope is seen at larger radii. This is included in the
discussion (Sect. 4).
2.2 Stellar mass-to-light ratio
From the analysis of SDSS multicolour photometry for Virgo dEs
(Lisker et al. 2008), we can derive an estimate of the stellar mass-to-light
ratio (M/L) of IC 3328, using the g-r and i-z colours measured within
the half-light radius. With stellar population synthesis models of
Bruzual & Charlot (2003), ``Padova
1994'' isochrones (Bertelli et al. 1994), a Chabrier (2003) initial mass
function, and an exponentially declining star formation rate (decay
time ![]() Gyr), we derive luminosity-weighted age and metallicity
values of 7.5 Gyr (time since the onset of star formation) and
Z=0.004 (corresponding to
Gyr), we derive luminosity-weighted age and metallicity
values of 7.5 Gyr (time since the onset of star formation) and
Z=0.004 (corresponding to
![]() ). When using
simple stellar population (SSP) models instead, the age changes to
5.9 Gyr. This perfectly agrees with the spectroscopic results
from the Lick index analysis of Michielsen et al. (2008), who find 6.0 Gyr and
). When using
simple stellar population (SSP) models instead, the age changes to
5.9 Gyr. This perfectly agrees with the spectroscopic results
from the Lick index analysis of Michielsen et al. (2008), who find 6.0 Gyr and
![]() using the SSP models of Vazdekis et al. (1996). It also
agrees with a preliminary spectroscopic analysis of ESO VLT/FORS2
spectra (Paudel et al., in prep.).
using the SSP models of Vazdekis et al. (1996). It also
agrees with a preliminary spectroscopic analysis of ESO VLT/FORS2
spectra (Paudel et al., in prep.).
The corresponding stellar M/L in V is (M/L)V=1.4. Despite the good agreement of age and metallicity from different sources, we use the rather large age uncertainties given by Michielsen et al. (2008) ( 6+9-4 Gyr) to obtain M/L uncertainties ( 1.4+1.4-0.8). This conservative approach is also supposed to cover any potential M/L uncertainties inherent to the modelling process.
2.3 Kinematical data
A rotation and velocity dispersion curve of IC 3328 was published by
Simien & Prugniel (2002), obtained from major-axis long-slit spectroscopy taken
at the Observatoire de Haute-Provence. For the analysis presented
here, the average of published velocity data points at opposite sides
of the centre was taken, and errors propagated accordingly. We
correct for the inclination (Sect. 2.1)
and consider
the effect of finite disk thickness on the line-of-sight
velocity distribution (Appendix A),
yielding the rotation curve shown in Fig. 3.
With the adopted intrinsic axis ratio of 0.33 (Lisker et al. 2007), the
resulting velocity correction is negligible (<![]() )
for radii beyond 0.5 disk
scalelengths.
The rotation curve
published by Geha et al. (2003) is not used due to its significantly
smaller radial extent.
)
for radii beyond 0.5 disk
scalelengths.
The rotation curve
published by Geha et al. (2003) is not used due to its significantly
smaller radial extent.
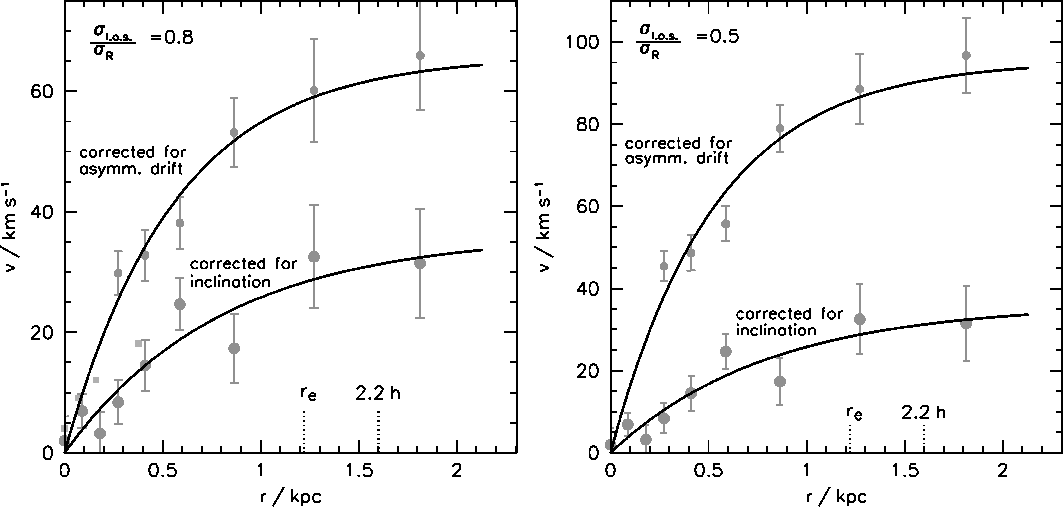 |
Figure 3:
Rotation curve and the effect of asymmetric drift.
Large filled circles are the inclination-corrected measurements from
Simien & Prugniel (2002). The lower solid curve is a fit of
|
| Open with DEXTER | |
3 Kinematical analysis
Our approach is to analyse the kinematical data of IC 3328 with the assumption of a pure disk, as implied by the vertical light profile of IC 3435 (Sect. 1). We then discuss whether a two-component galaxy would be more likely based on the results.
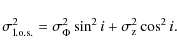
3.1 Velocity dispersion
The observed line-of-sight velocity dispersion
![]() is
more or less constant with radius, within the measurement
uncertainties (Simien & Prugniel 2002), at 35 km s-1. For major axis spectra,
it can be expressed in terms of the angular and the vertical velocity
dispersion as
is
more or less constant with radius, within the measurement
uncertainties (Simien & Prugniel 2002), at 35 km s-1. For major axis spectra,
it can be expressed in terms of the angular and the vertical velocity
dispersion as
Following Gerssen (2000), we adopt
 |
(2) |
which we estimate to be between 0.7 and 1. With the above range of factors, this yields values for
3.2 Asymmetric drift
While the asymmetric drift has a minor effect on the observed rotation
curves of normal spiral galaxies, it can be much more significant for
dwarf galaxies. The true orbital velocity at a
given radius,
![]() ,
and the observed velocity,
,
and the observed velocity,
![]() ,
are
related by the radial Jeans equation as follows (Binney & Tremaine 1987):
,
are
related by the radial Jeans equation as follows (Binney & Tremaine 1987):
 |
(3) |
with
with the surface mass density
Since we do not want to impose
any kinematical model on the analysis, we adopt the following simple method
to derive d
![]() and determine
and determine
![]() .
The observed,
inclination-corrected rotation curve is fitted with
.
The observed,
inclination-corrected rotation curve is fitted with
![]() ,
and
its derivative is used as initial estimate for d
,
and
its derivative is used as initial estimate for d
![]() at each data point.
The thus derived
first iteration for
at each data point.
The thus derived
first iteration for
![]() is then also fitted with f(r), and the derivative is now used as a better estimate for
d
is then also fitted with f(r), and the derivative is now used as a better estimate for
d
![]() ,
applying Eq. (4).
Here, the surface mass density
,
applying Eq. (4).
Here, the surface mass density ![]() is taken to be the observed
luminosity density, which is obtained from the surface brightness
profile (Fig. 1) and the adopted distance of
15.85 Mpc. No specific M/L value needs to be assumed for the conversion,
since it occurs in both the enumerator and the denominator of
the last term of Eq. (4), thus cancelling out.
In this and all following steps, we exclude data points at
is taken to be the observed
luminosity density, which is obtained from the surface brightness
profile (Fig. 1) and the adopted distance of
15.85 Mpc. No specific M/L value needs to be assumed for the conversion,
since it occurs in both the enumerator and the denominator of
the last term of Eq. (4), thus cancelling out.
In this and all following steps, we exclude data points at
![]() ,
since the luminosity density
is only reliable for radii significantly larger than the SDSS seeing FWHM
(
,
since the luminosity density
is only reliable for radii significantly larger than the SDSS seeing FWHM
(![]()
![]() ).
).
This leads to the second iteration on
![]() ,
and is repeated one more time. The resulting data
points for
,
and is repeated one more time. The resulting data
points for
![]() are then also fitted with f(r),
yielding a rotation curve instead of discrete data points alone.
The
differences between the last and second-last iterations are very
small (
are then also fitted with f(r),
yielding a rotation curve instead of discrete data points alone.
The
differences between the last and second-last iterations are very
small (![]() 2 km s-1).
In this procedure we always set
2 km s-1).
In this procedure we always set
![]() .
The
resulting curves are shown in the left panel of
Fig. 3 for our working value
.
The
resulting curves are shown in the left panel of
Fig. 3 for our working value
![]() km s-1 (Sect. 3.1), and in the right
panel for the extreme case of
km s-1 (Sect. 3.1), and in the right
panel for the extreme case of
![]() km s.
These are the
rotation curves that enter the calculations of the following sections.
km s.
These are the
rotation curves that enter the calculations of the following sections.
3.3 Toomre stability parameter
Table 1: Mass-to-light ratio in V, using the colour transformation V=r+0.27 (Smith et al. 2002).
An important diagnostic of the dynamics of a galactic disk is the
Toomre (1964) stability parameter:
 |
(5) |
where
To properly consider the disk thickness (adopted
intrinsic axis ratio 0.33, see Sects. 1 and 2), we calculate how much
more mass a thicker disk
contains per surface area if it has the desired properties for spiral
arm development (Appendix B). This is equivalent to using an
``effective Q'' value that is lower than the actual one for a thin
disk. The above range of ![]() thus changes to
thus changes to
![]() for the case
for the case
![]() km s-1, and
km s-1, and
![]() for
for
![]() km s-1.
km s-1.
Table 1 shows the resulting values for M/L at the half-light radius when choosing
Q=1.0,1.5,2.0 (i.e.,
![]() for
for
![]() km s-1, etc.).
These are
compared to the stellar M/L from Sect. 2.2.
km s-1, etc.).
These are
compared to the stellar M/L from Sect. 2.2.
The thus derived mass density at the half-light radius can be used to predict the rotational velocity for an exponential disk model and for a Mestel disk. These values are listed in Table 2 and illustrated in Fig. 4, again for the three Q values.
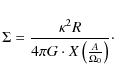
3.4 Density wave theory
An
alternative estimate for the mass density can be obtained from density wave
theory. It predicts the circumferential wavelength
![]() at which density waves mainly grow. In terms of the
critical wavelength (Toomre 1964),
at which density waves mainly grow. In terms of the
critical wavelength (Toomre 1964),

the preferred wavelength is given by (Toomre 1981; Athanassoula et al. 1987)
The coefficient X depends on the shape of the rotation curve, measured by Oort's constant A, with
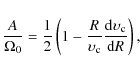 |
(8) |
and is given in Fuchs (2001)

From Eqs. (6), (7), and (9), we have
 |
(10) |
In contrast to the Toomre parameter, this involves no velocity dispersion
4 Discussion
The analysis of IC 3328 by Jerjen et al. (2000) shows that the spiral structure holds clues to its dynamical configuration. However, no rotation curve had been obtained then. With the now available kinematical data from Simien & Prugniel (2002), a more detailed investigation was possible.
While the mass-to-light ratios derived with the Toomre criterion
clearly exceed the stellar M/L (Table 1), the value derived
using density wave theory is still compatible with the stellar value.
The predicted rotation curve of the exponential model from
![]() provides
good agreement with the measured, asymmetric-drift-corrected
curve (Fig. 4). However, as for the M/L, the curves derived from
the Toomre criterion lie at velocities that are too high, implying that the
picture of a pure disk is probably too simple.
provides
good agreement with the measured, asymmetric-drift-corrected
curve (Fig. 4). However, as for the M/L, the curves derived from
the Toomre criterion lie at velocities that are too high, implying that the
picture of a pure disk is probably too simple.
For the case
of a very high velocity dispersion, the M/L values are
substantially higher (columns labelled ``
![]() km s-1'' in Tables 1
and 2), and now the value from
km s-1'' in Tables 1
and 2), and now the value from
![]() is also incompatible with the observed stellar range. The velocities show
the same relative behaviour as for the lower velocity dispersion:
the model velocities from the Toomre criterion are higher than those
from
is also incompatible with the observed stellar range. The velocities show
the same relative behaviour as for the lower velocity dispersion:
the model velocities from the Toomre criterion are higher than those
from
![]() ,
which agree with the measured curve.
However, the high M/L values might indicate that the actual velocity dispersion is indeed
lower than in this extreme case. Of course one could argue that a
significant amount of dark matter is present as well; and yet,
Geha et al. (2002) conclude that dark matter does not contribute significantly
within the half-light radius for their (admittedly small) Virgo dE sample.
,
which agree with the measured curve.
However, the high M/L values might indicate that the actual velocity dispersion is indeed
lower than in this extreme case. Of course one could argue that a
significant amount of dark matter is present as well; and yet,
Geha et al. (2002) conclude that dark matter does not contribute significantly
within the half-light radius for their (admittedly small) Virgo dE sample.
The M/L values from
![]() are thus the only ones that
are at least partly consistent with the inferred stellar value. A major
difference between the Toomre criterion and the density wave approach is
that velocity
dispersion does not enter the latter directly - only implicitly
through the asymmetric drift correction - but it does enter the Toomre
parameter directly, which yields M/L values that are too high. This
might hint at a
significant dynamically hot component being
present in addition to the disk. If such a component contributed
substantially to the measured velocity dispersion, the disk
component's own velocity dispersion would be significantly
smaller. This would reduce the surface mass density inferred from the
Toomre criterion towards the value derived from
are thus the only ones that
are at least partly consistent with the inferred stellar value. A major
difference between the Toomre criterion and the density wave approach is
that velocity
dispersion does not enter the latter directly - only implicitly
through the asymmetric drift correction - but it does enter the Toomre
parameter directly, which yields M/L values that are too high. This
might hint at a
significant dynamically hot component being
present in addition to the disk. If such a component contributed
substantially to the measured velocity dispersion, the disk
component's own velocity dispersion would be significantly
smaller. This would reduce the surface mass density inferred from the
Toomre criterion towards the value derived from
![]() .
.
Table 2: Rotational velocity, with values at the half-light radius for an exponential disk and a Mestel disk, using the same cases as in Table 1.
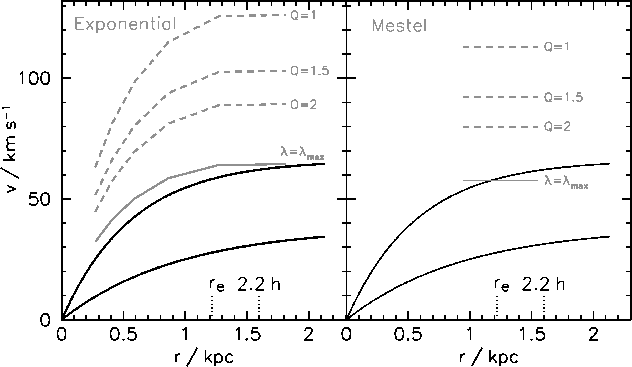 |
Figure 4:
Measured versus predicted rotational velocities. The black lines are the same as in the left panel of
Fig. 3, i.e. for
|
| Open with DEXTER | |
As for the rotational velocity, since the contribution of the asymmetric drift is directly related to the disk's velocity dispersion, its contribution would be much smaller in the case just described. This would lower both the observational and model velocities, again with particular relevance to the Toomre criterion.
We illustrate this possibility by repeating our analysis with a
significantly lower
velocity dispersion of
![]() km s-1and a smaller half-light
radius of 0.9 kpc. The latter represents only the ``inner'' component of a
double-exponential fit to the light profile of Fig. 1,
which yielded a ratio of the two components' scalelengths of 3:10, with a
central intensity ratio of 33:2. Obviously, the
asymmetric drift contribution is much smaller in this scenario. The choice of
km s-1and a smaller half-light
radius of 0.9 kpc. The latter represents only the ``inner'' component of a
double-exponential fit to the light profile of Fig. 1,
which yielded a ratio of the two components' scalelengths of 3:10, with a
central intensity ratio of 33:2. Obviously, the
asymmetric drift contribution is much smaller in this scenario. The choice of
![]() km s-1 is such that the two approaches,
km s-1 is such that the two approaches,
![]() and the Toomre criterion, agree with each
other in the predicted rotational velocities and also the mass-to-light ratios
(Tables 1 and 2, rightmost
column)
and the Toomre criterion, agree with each
other in the predicted rotational velocities and also the mass-to-light ratios
(Tables 1 and 2, rightmost
column)![]() .
In this case, the derived M/L values
appear to be somewhat lower than the inferred stellar M/L - but,
given
that now the disk contributes only part of the light that is used
for the calculation, the values are very compatible.
The model rotational velocities also agree with the
measured value. This leads to a coherent picture, in which IC 3328
consists of a dynamically hot component with an embedded thin disk.
.
In this case, the derived M/L values
appear to be somewhat lower than the inferred stellar M/L - but,
given
that now the disk contributes only part of the light that is used
for the calculation, the values are very compatible.
The model rotational velocities also agree with the
measured value. This leads to a coherent picture, in which IC 3328
consists of a dynamically hot component with an embedded thin disk.
Nevertheless, this interpretation must be regarded with some caution, given the measurement uncertainties, the moderate radial extent of the kinematical data, and the number of assumptions and simplifications made in the analysis. Clearly, it would be desirable to obtain kinematical data of higher quality, in order to decrease the measurement errors and to trace the curve to larger radii. Furthermore, minor axis data would be desirable for pinning down the velocity anisotropy.
Finally, we mention again that no thin disk component is seen in the vertical light profile of the apparently edge-on dE(di) IC 3435 (see Sect. 1). It is of course not known whether this galaxy hosts similar spiral structure. Nevertheless, if indeed IC 3328 had a thin disk surrounded by a hotter component, then IC 3435 would not be an edge-on version of the same kind of object.
5 Summary
We attempted to gain insight into the actual nature of early-type dwarf galaxies with weak spiral structure by analysing the kinematical data of IC 3328, the prototype of this galaxy population. To our knowledge, no other object of this kind has kinematical data of sufficient quality. Based on mass-to-light ratios derived with different methods, we find that the observed velocity dispersion of IC 3328 cannot be fully attributed to a stellar disk, but that a distinct dynamically hot component is present. An unambiguous conclusion is, however, not possible, due to the moderate radial coverage and the lack of minor-axis kinematical data. We thus see our study as motivation to increase the amount of good-quality kinematical observations for dEs.
Acknowledgements
We thank Eva Grebel for initiating this collaboration, and the referee, Albert Bosma, for constructive suggestions. T.L. is supported within the framework of the Excellence Initiative by the German Research Foundation (DFG) through the Heidelberg Graduate School of Fundamental Physics (grant number GSC 129/1). This research has made use of the VizieR catalogue access tool, CDS, Strasbourg, France, and of NASA's Astrophysics Data System Bibliographic Services.
Appendix A: Finite disk thickness correction of the observed rotation curve
To obtain a first-order correction for the finite thickness of the disk, we approximate the density profile of the galaxy with a double exponential,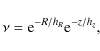
and then integrate along the line of sight over the density-weighted rotational velocity:
with N the normalization factor,
We assume that the vertical scalelength hz is much shorter
than the radial scalelength hR, and perform a Taylor expansion
of the integrand about z=0 to second order. After the integration, we
neglect terms higher than second order in hz, yielding
Adopting hR/hz=3 (Lisker et al. 2006b) and using the inclination
Appendix B: The Toomre stability criterion corrected for the finite thickness of galactic disks
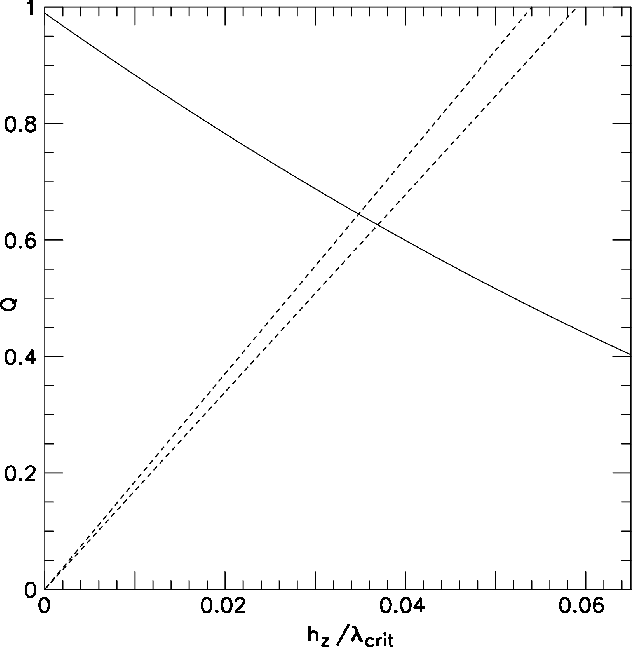 |
Figure B.1:
The Toomre Q parameter corrected for the finite thickness
|
| Open with DEXTER | |
The gravitational potential of a Fourier component of the surface density
of an infinitesimally thin disk is given by
where k denotes the wave number of the Fourier term. Following Toomre (1964) we consider a disk of finite thickness as a superposition of infinitesimally thin disks,
which leads at the midplane to
In the following we use the reduction term (1+khz)-1, which is slightly different from that adopted by Toomre (1964), to modify the diagnostics of the dynamical state of a galactic disk for finite thickness.
Fuchs & von Linden (1998) show in their Appendix A1 how such a correction term must be
applied to the dispersion relation for ring-like perturbations of the
disk. In their analysis, Fuchs & von Linden (1998) adopted an exponential velocity
distribution. If we switch back to a Schwarzschild distribution as assumed
by Toomre (1964), we find for the line separating exponentially growing
perturbations from neutrally stable perturbations in the space spanned by
![]() (or Q) and the
wavenumber,
(or Q) and the
wavenumber,
where
When Q is drawn as a function of
![]() ,
we always find a lower limit for Q, above
which perturbations are stable on all wavelengths. This is illustrated as
a solid line in Fig. B.1. As can be seen from the
figure, the allowed Q values are lower
than one, which means that a disk of finite thickness can be significantly
more massive than an infinitesimally thin disk, but still be dynamically
stable.
However, it needs to be taken into account that
the vertical scale height hz in units of
,
we always find a lower limit for Q, above
which perturbations are stable on all wavelengths. This is illustrated as
a solid line in Fig. B.1. As can be seen from the
figure, the allowed Q values are lower
than one, which means that a disk of finite thickness can be significantly
more massive than an infinitesimally thin disk, but still be dynamically
stable.
However, it needs to be taken into account that
the vertical scale height hz in units of
![]() enters into the calculation. Therefore, if one increases the disk surface
density, Q will drop, but
enters into the calculation. Therefore, if one increases the disk surface
density, Q will drop, but
![]() drops as
well. Thus the most massive, but still dynamically stable disk model is
reached when Q (originally Q=1) has dropped by the same fraction as
the originally calculated
drops as
well. Thus the most massive, but still dynamically stable disk model is
reached when Q (originally Q=1) has dropped by the same fraction as
the originally calculated
![]() .
These models
are indicated by the intersections of the solid line and the dashed lines
in Fig. B.1.
.
These models
are indicated by the intersections of the solid line and the dashed lines
in Fig. B.1.
Appendix C: Density wave theory analysis with a correction for finite thickness
We use the same reduction factor as derived in Appendix B to
correct the prediction of density wave theory for finite thickness of the
disk. Since we follow ``swing-amplification'' theory (Toomre 1981), we can
straightforwardly use the formalism of Fuchs (2001). We multiplied
the kernel
![]() of his Eq. (68) by the reduction factor
of his Eq. (68) by the reduction factor
![]() and
again solved
the Volterra integral equation. The main result is that the
operation characteristics of the swing-amplifier mechanism, i.e. at which
ky and
and
again solved
the Volterra integral equation. The main result is that the
operation characteristics of the swing-amplifier mechanism, i.e. at which
ky and
![]() amplification peaks, are hardly affected
by this correction, the effect being of the order of 15%. Only the
amplification amplitude is much reduced as compared to infinitesimally
thin disks. This shows
again that disks of finite thickness are dynamically more stable than
razor-thin disks.
amplification peaks, are hardly affected
by this correction, the effect being of the order of 15%. Only the
amplification amplitude is much reduced as compared to infinitesimally
thin disks. This shows
again that disks of finite thickness are dynamically more stable than
razor-thin disks.
References
- Adelman-McCarthy, J. K., Agüeros, M. A., Allam, S. S., et al. 2007, ApJS, 172, 634 [NASA ADS] [CrossRef] (In the text)
- Athanassoula, E., Bosma, A., & Papaioannou, S. 1987, A&A, 179, 23 [NASA ADS]
- Bertelli, G., Bressan, A., Chiosi, C., Fagotto, F., & Nasi, E. 1994, A&AS, 106, 275 [NASA ADS] (In the text)
- Binney, J., & Tremaine, S. 1987, Galactic dynamics (Princeton, NJ: Princeton University Press), 747 (In the text)
- Bruzual, G., & Charlot, S. 2003, MNRAS, 344, 1000 [NASA ADS] [CrossRef] (In the text)
- Chabrier, G. 2003, PASP, 115, 763 [NASA ADS] [CrossRef] (In the text)
- Ferguson, H. C., & Sandage, A. 1989, ApJ, 346, L53 [NASA ADS] [CrossRef]
- Fuchs, B. 2001, A&A, 368, 107 [NASA ADS] [CrossRef] [EDP Sciences] (In the text)
- Fuchs, B. 2008, Invited contribution to Galactic and Stellar Dynamics in the era of high resolution surveys, Strasbourg, March 16-20 [arXiv:0810.3503] (In the text)
- Fuchs, B., & von Linden, S. 1998, MNRAS, 294, 513 [NASA ADS] [CrossRef] (In the text)
- Geha, M., Guhathakurta, P., & van der Marel, R. P. 2002, AJ, 124, 3073 [NASA ADS] [CrossRef] (In the text)
- Geha, M., Guhathakurta, P., & van der Marel, R. P. 2003, AJ, 126, 1794 [NASA ADS] [CrossRef] (In the text)
- Gerssen, J. 2000, Stellar kinematics in disk galaxies (Groningen: Proefschrift, Rijksuniversiteit) (In the text)
- Jerjen, H., Kalnajs, A., & Binggeli, B. 2000, A&A, 358, 845 [NASA ADS] (In the text)
- Kormendy, J., Fisher, D. B., Cornell, M. E., & Bender, R. 2009, ApJS, 182, 216 [NASA ADS] [CrossRef] (In the text)
- Lisker, T., Glatt, K., Westera, P., & Grebel, E. K. 2006a, AJ, 132, 2432 [NASA ADS] [CrossRef]
- Lisker, T., Grebel, E. K., & Binggeli, B. 2006b, AJ, 132, 497 [NASA ADS] [CrossRef]
- Lisker, T., Grebel, E. K., & Binggeli, B. 2008, AJ, 135, 380 [NASA ADS] [CrossRef]
- Lisker, T., Grebel, E. K., Binggeli, B., & Glatt, K. 2007, ApJ, 660, 1186 [NASA ADS] [CrossRef]
- Mastropietro, C., Moore, B., Mayer, L., et al. 2005, MNRAS, 364, 607 [NASA ADS] (In the text)
- Michielsen, D., Boselli, A., Conselice, C. J., et al. 2008, MNRAS, 385, 1374 [NASA ADS] [CrossRef] (In the text)
- Moore, B., Katz, N., Lake, G., Dressler, A., & Oemler, A. 1996, Nature, 379, 613 [NASA ADS] [CrossRef] (In the text)
- Simien, F., & Prugniel, P. 2002, A&A, 384, 371 [NASA ADS] [CrossRef] [EDP Sciences] (In the text)
- Smith, J. A., Tucker, D. L., Kent, S., et al. 2002, AJ, 123, 2121 [NASA ADS] [CrossRef] (In the text)
- Tody, D. 1993, in Astronomical Data Analysis Software and Systems II, ASP Conf. Ser., 52, 173 (In the text)
- Toomre, A. 1964, ApJ, 139, 1217 [NASA ADS] [CrossRef] (In the text)
- Toomre, A. 1981, in Structure and Evolution of Normal Galaxies, ed. S. M. Fall, & D. Lynden-Bell (Cambridge: CUP), 111
- van den Bergh, S. 1996, PASP, 108, 1091 [NASA ADS] [CrossRef] (In the text)
- Vazdekis, A., Casuso, E., Peletier, R. F., & Beckman, J. E. 1996, ApJS, 106, 307 [NASA ADS] [CrossRef] (In the text)
Footnotes
- ... structure
- Partly based on observations collected at the European Organisation for Astronomical Research in the Southern Hemisphere, Chile, for program 077.B-0785.
- ... IRAF/ellipse
- IRAF is distributed by the National Optical Astronomy Observatories, which are operated by the Association of Universities for Research in Astronomy, Inc., under cooperative agreement with the National Science Foundation.
- ...Fuchs (2001)
- Actually, 1/X is given there.
- ...
dispersion
- Since these calculations are performed based on
the asymmetric-drift-corrected rotation curve, a dependence
on velocity dispersion is implicitly included through
 ,
since the derivation
of
,
since the derivation
of
 from the observed
 involves
 (see Eq. (4)).
- ...
column)
-
Following Sect. 3.3 and
Appendix B, we use here an
``effective Q'' range of
 ,
corresponding to an
intrinsic disk axis ratio of 0.1.
,
corresponding to an
intrinsic disk axis ratio of 0.1.
All Tables
Table 1: Mass-to-light ratio in V, using the colour transformation V=r+0.27 (Smith et al. 2002).
Table 2: Rotational velocity, with values at the half-light radius for an exponential disk and a Mestel disk, using the same cases as in Table 1.
All Figures
| |
Figure 1:
Appearance and light profile of IC 3328. Surface
brightness in SDSS-r versus radius, adopting a distance modulus
m-M=31.0 mag (d=15.85 Mpc, van den Bergh 1996), corresponding to a scale of
77 pc/
|
| Open with DEXTER | |
| In the text | |
| |
Figure 2:
Light profile in z-direction of IC 3435. SDSS r-band
image (inset) of IC 3435, and the intensity profile obtained by
collapsing the outlined box-shaped region along the galaxy's major
axis. The box has a side length corresponding to the major axis of
the half-light elliptical isophote, or equivalently, three times its
minor axis. Smearing due to seeing effects can occur in the innermost
|
| Open with DEXTER | |
| In the text | |
| |
Figure 3:
Rotation curve and the effect of asymmetric drift.
Large filled circles are the inclination-corrected measurements from
Simien & Prugniel (2002). The lower solid curve is a fit of
|
| Open with DEXTER | |
| In the text | |
| |
Figure 4:
Measured versus predicted rotational velocities. The black lines are the same as in the left panel of
Fig. 3, i.e. for
|
| Open with DEXTER | |
| In the text | |
| |
Figure B.1:
The Toomre Q parameter corrected for the finite thickness
|
| Open with DEXTER | |
| In the text | |
Copyright ESO 2009
Current usage metrics show cumulative count of Article Views (full-text article views including HTML views, PDF and ePub downloads, according to the available data) and Abstracts Views on Vision4Press platform.
Data correspond to usage on the plateform after 2015. The current usage metrics is available 48-96 hours after online publication and is updated daily on week days.
Initial download of the metrics may take a while.