Fig. 6
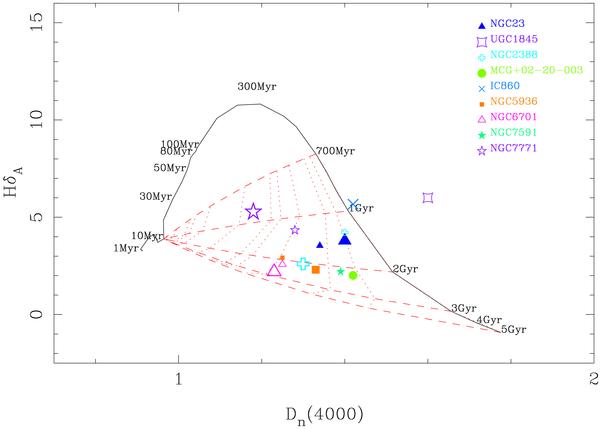
Dn(4000) vs. HδA diagram. The small symbols are the measurements from the average spectrum of the regions with low EW(Hα)em of each LIRG, whereas the large symbols are the measurements corresponding to the nuclear regions (see Table 4). For NGC 7591 we plot the values corresponding to the integrated spectrum. Note that in the majority of nuclei the HδA indices are lower limits due to possible contamination from the nebular Hδ emission line. The black solid line is the time evolution (from 1 Myr to 5 Gyr) as predicted by the BC03 models using solar metallicity, a Salpeter IMF, and an instantaneous burst of star formation. The dashed lines are combinations of different evolved populations (ages 700 Myr, 1 Gyr, 2 Gyr, 3 Gyr, and 5 Gyr) and a young stellar population of 10 Myr. The dotted lines represent the fraction in mass of young stars with values of 0.001, 0.002, 0.005, 0.008, 0.01, 0.02, 0.05, 0.08, 0.1, 0.2, 0.5, and 0.8, from right to left.
Current usage metrics show cumulative count of Article Views (full-text article views including HTML views, PDF and ePub downloads, according to the available data) and Abstracts Views on Vision4Press platform.
Data correspond to usage on the plateform after 2015. The current usage metrics is available 48-96 hours after online publication and is updated daily on week days.
Initial download of the metrics may take a while.