Free Access
Fig. 8
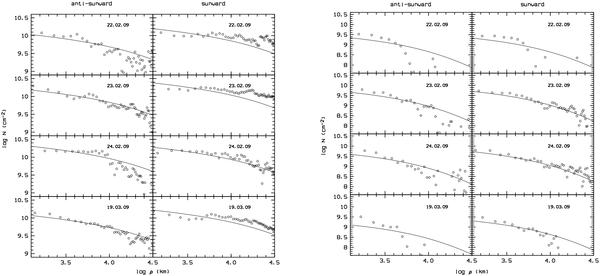
Observed CN and C3 column density profiles in cm-2 versus ρ (open circles) in log-log representation together with the best achievable fit (solid line) obtained by means of the Haser modelling (Haser 1957) with parameters given in the text and production rates listed in Table 3.
This figure is made of several images, please see below:
Current usage metrics show cumulative count of Article Views (full-text article views including HTML views, PDF and ePub downloads, according to the available data) and Abstracts Views on Vision4Press platform.
Data correspond to usage on the plateform after 2015. The current usage metrics is available 48-96 hours after online publication and is updated daily on week days.
Initial download of the metrics may take a while.