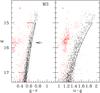
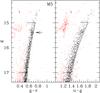
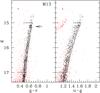
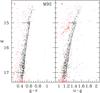
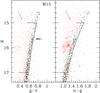
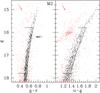
Fig. 2
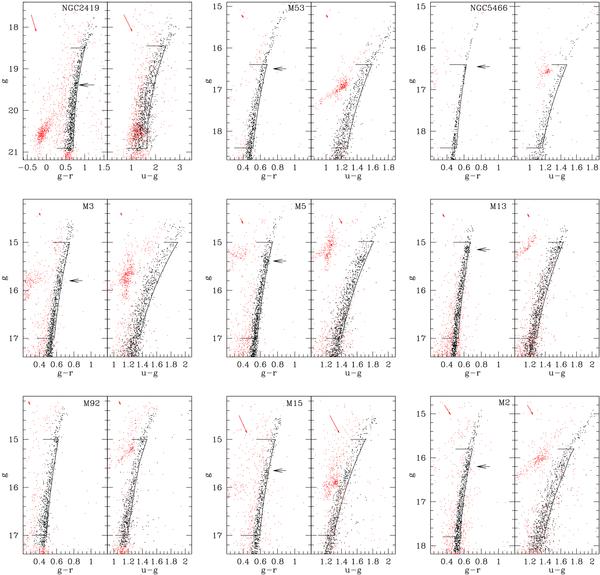
g − r, g and g, u − g CMDs for the GCs in our sample. In some cases, the RGB is truncated due to SDSS saturation. The red arrows in the upper right corner of each panel are the reddening vectors whose amplitudes correspond to the average E(B − V) values reported in Table 1. Horizontal black arrows mark the position of the RGB bump. Stars selected as candidate RGB on the (g, g − r) CMDs are plotted as heavy dark dots, the remaining ones as lighter red dots. The curves approximately tracing the red edges of the RGBs are used as references to compute the color spread distributions shown in Fig. 3; the two horizontal segments display the portion of the RGB that is used to compute those distributions. In most cases, note that the asymptotic giant branch starts above the bright end of the adopted selection box (NGC 2419 is an obvious exception).
Current usage metrics show cumulative count of Article Views (full-text article views including HTML views, PDF and ePub downloads, according to the available data) and Abstracts Views on Vision4Press platform.
Data correspond to usage on the plateform after 2015. The current usage metrics is available 48-96 hours after online publication and is updated daily on week days.
Initial download of the metrics may take a while.