Fig. 1
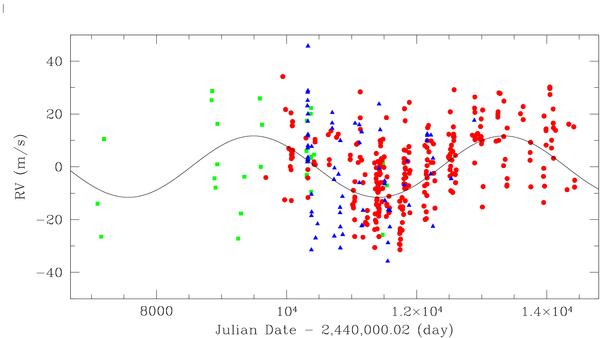
Residuals of the best 3-planet fit model for the combined data set including 385 radial velocities obtained at Lick and with ELODIE (see text). The red circles corresponds to the 284 radial velocities taken at Lick and published by Wright et al. (2009), the green squares correspond to the additional 30 radial velocities taken at Lick and published by Fischer et al. (2003) and the blue triangles correspond to the 71 radial velocities taken with ELODIE and published by Naef et al. (2004). The solid line corresponds to the solution obtain with the best 4-planet fit model to the combined data set (see Table 1 and Fig. 2).
Current usage metrics show cumulative count of Article Views (full-text article views including HTML views, PDF and ePub downloads, according to the available data) and Abstracts Views on Vision4Press platform.
Data correspond to usage on the plateform after 2015. The current usage metrics is available 48-96 hours after online publication and is updated daily on week days.
Initial download of the metrics may take a while.