Fig. 2
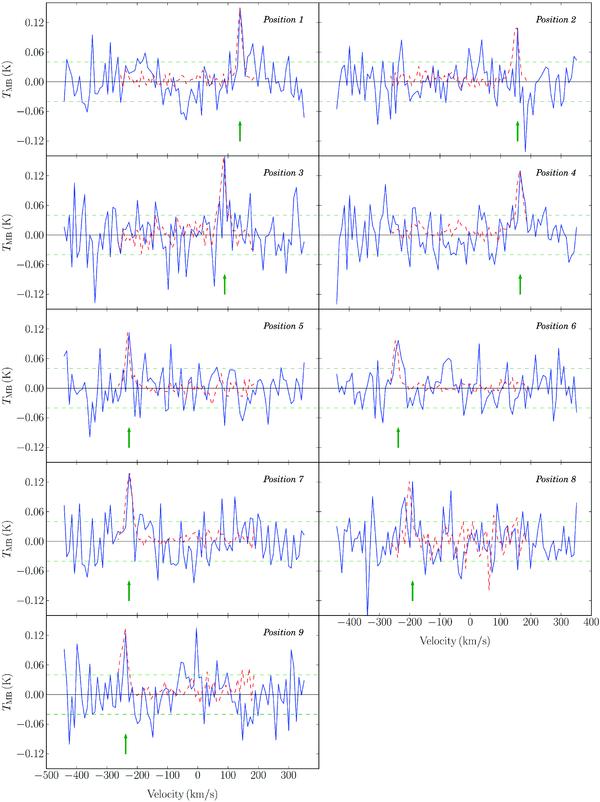
CO J = 3−2 spectra (blue solid) obtained from the peak pixel of each position where we detected CO, compared to the H i spectra (red dashed) at those positions. In each case the spectra have been smoothed to Δv = 10 km s-1 and the H i profile has been scaled to fit the CO peak (pointed out with an arrow at each position). No spatial smoothing was applied. The green dashed lines mark the σ ~ ± 0.04 K average level (see Table 2). The positions labeled are the same as in Figs. 3 and 4.
Current usage metrics show cumulative count of Article Views (full-text article views including HTML views, PDF and ePub downloads, according to the available data) and Abstracts Views on Vision4Press platform.
Data correspond to usage on the plateform after 2015. The current usage metrics is available 48-96 hours after online publication and is updated daily on week days.
Initial download of the metrics may take a while.