Fig. 3
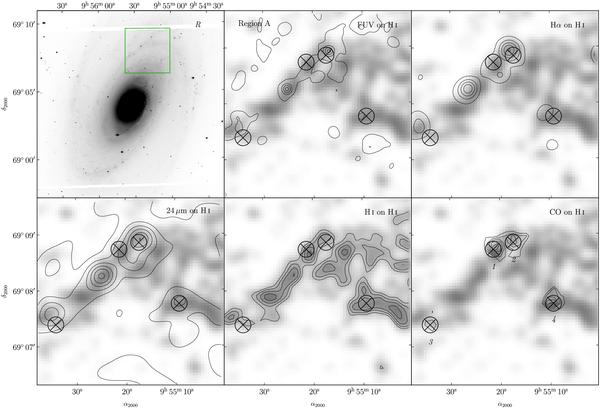
Each panel shows the contours of the indicated wavelength band or image, as labelled, overlaid on the H i image of region A. Both the H i map and the contours have been smoothed to match the 14.5 arcsec resolution of the CO data (see Sect. 2.5). FUV levels start at 5 × 10-18ergcm-2s-1Å-1arcsec-2 increasing by the same amount for each new contour. H i contour levels go from 7.68 × 10²⁰ to 6.53 × 10²¹ in steps of 3.84 × 10²⁰ atomscm-2. The CO intensity levels start at 0.4Kkms-1 (~1σ) and each new level increases 0.2 K km s-1. Hα and 24μm contour levels are arbitrary. The top left panel shows the footprint of region A plotted on the R-band image. Note that the declinations of the FUV and Hα panels are as those in the 24μm panel. The crosses indicate the position of each CO feature, while the circles define a region of 150 pc around this central value. The identification of the CO positions is given in the bottom right panel and is referred to in Table 2.
Current usage metrics show cumulative count of Article Views (full-text article views including HTML views, PDF and ePub downloads, according to the available data) and Abstracts Views on Vision4Press platform.
Data correspond to usage on the plateform after 2015. The current usage metrics is available 48-96 hours after online publication and is updated daily on week days.
Initial download of the metrics may take a while.