Fig. 7
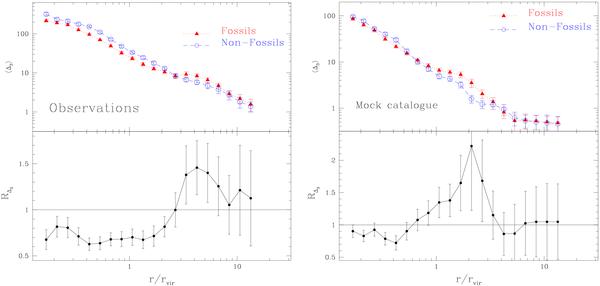
Local density profile of galaxies around groups as a function of the normalised group-centric distance. Left upper panel show the local density profiles for fossils and normal systems identified observationally (see Table 1) while right upper panel show the profiles for Fossils and ΔM12 < 0.5 mag groups in the MS when introducing a brighter cut-off in the R-band absolute magnitude. Error bars are the 35th and the 65th percentiles in the local density distribution at each distance bin. Lower panels show the corresponding ratios of local density profiles in each case.
Current usage metrics show cumulative count of Article Views (full-text article views including HTML views, PDF and ePub downloads, according to the available data) and Abstracts Views on Vision4Press platform.
Data correspond to usage on the plateform after 2015. The current usage metrics is available 48-96 hours after online publication and is updated daily on week days.
Initial download of the metrics may take a while.