Fig. 10
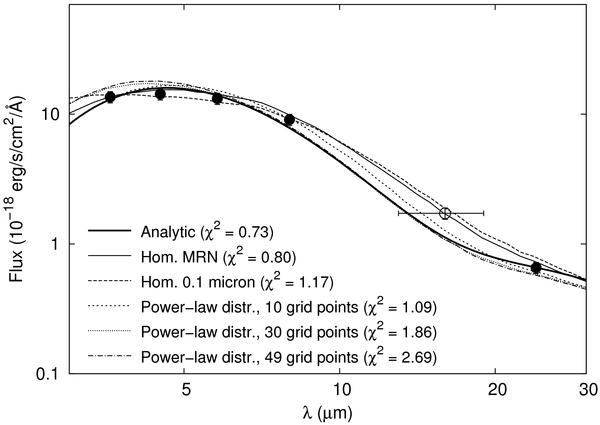
Comparison of the best fitting analytic and MOCASSIN models with the observed SED for 849 − 883 days. See text and Tables 6 − 8 for the explanation of the different models. Models assuming the MRN grain-size distribution were found to be the best to reproduce the observations. The IRS PUI flux (empty circle) was not used during the fitting.
Current usage metrics show cumulative count of Article Views (full-text article views including HTML views, PDF and ePub downloads, according to the available data) and Abstracts Views on Vision4Press platform.
Data correspond to usage on the plateform after 2015. The current usage metrics is available 48-96 hours after online publication and is updated daily on week days.
Initial download of the metrics may take a while.