Fig. 7
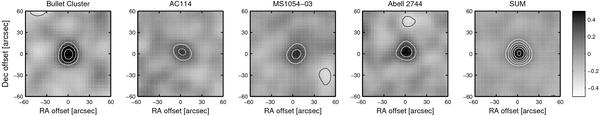
Stacked 870 μm maps (in units of mJy beam-1) on the 24 μm positions for the cluster fields with MIPS observations, overlaid with signal-to-noise contours. The white contours range between 3σ and 13σ with an increment of 2σ, while the black countours show the − 3σ level. The maps have not been corrected for gravitational magnification. The fifth map is the coadded signal of the four individual stacked maps, which yields a 14.5σ-detection. In Table 6 we present fits to the stacked maps.
Current usage metrics show cumulative count of Article Views (full-text article views including HTML views, PDF and ePub downloads, according to the available data) and Abstracts Views on Vision4Press platform.
Data correspond to usage on the plateform after 2015. The current usage metrics is available 48-96 hours after online publication and is updated daily on week days.
Initial download of the metrics may take a while.