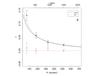
Fig. 8
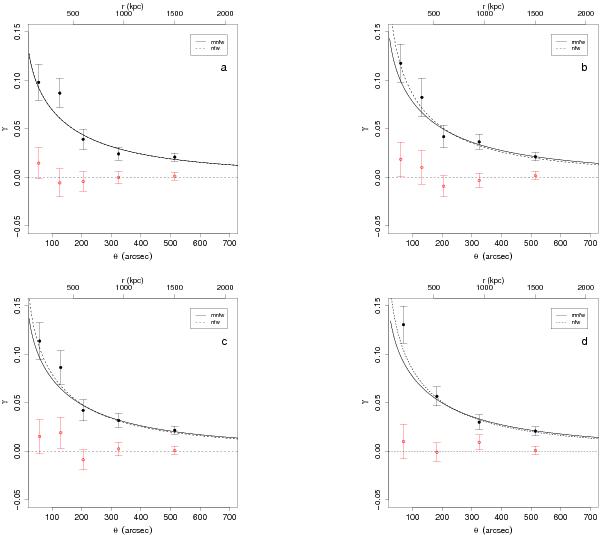
Shear profiles obtained with the different selection methods (see Table 4, where the parameters derived for each model are given). The fitting was done using the maximum likelihood approach. Binned points are shown for display purposes only. In panel a, the curves obtained by the two models (nfw/mnfw) overlap.
Current usage metrics show cumulative count of Article Views (full-text article views including HTML views, PDF and ePub downloads, according to the available data) and Abstracts Views on Vision4Press platform.
Data correspond to usage on the plateform after 2015. The current usage metrics is available 48-96 hours after online publication and is updated daily on week days.
Initial download of the metrics may take a while.